


Page 86 - Read Online
P. 86
Page 8 of 18                    Shang et al. Carbon Footprints 2025, 4, 24  https://dx.doi.org/10.20517/cf.2025.28

               Table 1. Policy scenarios for methane emissions control from waste in China
                                                                                       Livestock and poultry
                Scenario        Municipal solid waste  Urban sewage  Agricultural cropping
                                                                                       farming
                Business as usual (BAU) Current government measures maintained. 10% of the methane generated in the four waste sub-sectors is collected
                                and utilized
                Urban waste recycling   Methane recovery from   Methane utilization from   -  -
                policy (UWR)    landfills reaches 60% by   COD in sewage reaches
                                2025 and 80% by 2030  45% by 2025 and 50% by
                                                  2030
                Agricultural carbon   -           -                  Straw fuel utilization   Utilization of livestock and
                reduction and                                        exceeds 15% by 2025 and  poultry waste exceeds 80%
                sequestration (ACRS)                                 20% by 2030       by 2025 and 85% by 2030


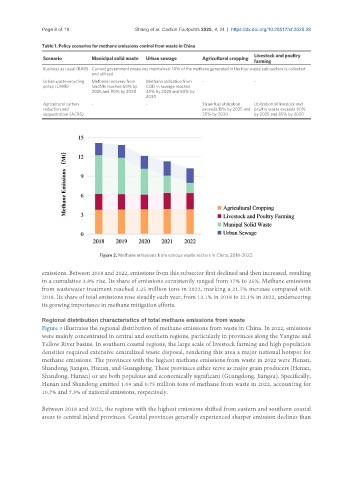
                                   Figure 2. Methane emissions from various waste sectors in China, 2018-2022.


               emissions. Between 2018 and 2022, emissions from this subsector first declined and then increased, resulting
               in a cumulative 3.8% rise. Its share of emissions consistently ranged from 17% to 25%. Methane emissions
               from wastewater treatment reached 2.25 million tons in 2022, marking a 21.7% increase compared with
               2018. Its share of total emissions rose steadily each year, from 13.1% in 2018 to 22.1% in 2022, underscoring
               its growing importance in methane mitigation efforts.


               Regional distribution characteristics of total methane emissions from waste
               Figure 3 illustrates the regional distribution of methane emissions from waste in China. In 2022, emissions
               were mainly concentrated in central and southern regions, particularly in provinces along the Yangtze and
               Yellow River basins. In southern coastal regions, the large scale of livestock farming and high population
               densities required extensive centralized waste disposal, rendering this area a major national hotspot for
               methane emissions. The provinces with the highest methane emissions from waste in 2022 were Henan,
               Shandong, Jiangsu, Hunan, and Guangdong. These provinces either serve as major grain producers (Henan,
               Shandong, Hunan) or are both populous and economically significant (Guangdong, Jiangsu). Specifically,
               Henan and Shandong emitted 1.09 and 0.75 million tons of methane from waste in 2022, accounting for
               10.7% and 7.3% of national emissions, respectively.

               Between 2018 and 2022, the regions with the highest emissions shifted from eastern and southern coastal
               areas to central inland provinces. Coastal provinces generally experienced sharper emission declines than

