


Page 91 - Read Online
P. 91
Shang et al. Carbon Footprints 2025, 4, 24  https://dx.doi.org/10.20517/cf.2025.28                                         Page 13 of 18

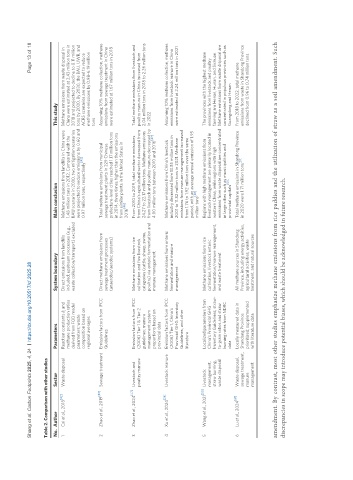
               Table 2. Comparison with other studies
                No. Author      Sector       Parameters          System boundary         Main conclusion                This study
                1  Cai et al., 2018 [42]  Waste disposal  Reaction constants k and   Direct emissions from landfills   Methane emissions from landfills in China were  Methane emissions from waste disposal in
                                                          i
                                             methane production ratios   included; upstream processes (e.g.,   1.48 million tons in 2012. Compared with the   China were estimated at 2.43 million tons in
                                             derived from FOD model   waste collection/transport) excluded BAU scenario in 2030, two mitigation scenarios  2018 and projected to decline to 0.11 million
                                             parameters; waste                           were projected to reduce emissions by 0.60 and  tons by 2030. By 2030, the BAU, UWR, and
                                                                                                            [42]
                                             composition based on                        0.97 million tons, respectively  ACRS scenarios are expected to reduce
                                             regional averages                                                          methane emissions by 0.98~6.19 million
                                                                                                                        tons
                2  Zhao et al., 2019 [46]  Sewage treatment Emission factors from IPCC   Direct methane emissions from   Total methane emissions from municipal   Assuming 10% methane collection, methane
                                             Guidelines          sewage treatment processes   sewage treatment plants in 229 Chinese   emissions from sewage treatment in China
                                                                 (anaerobic/aerobic systems)   prefecture-level cities reached 1.17 million tons   were estimated at 1.67 million tons in 2018
                                                                                         in 2014, three times higher than the emissions
                                                                                         from similar plants in the United States in
                                                                                            [46]
                                                                                         2016
                             [47]
                3  Zhao et al., 2024  Livestock and   Emission factors from IPCC   Methane emissions from rice   From 2010 to 2019, total methane emissions   Total methane emissions from livestock and
                                poultry manure  (2006) Tier 1 & Tier 2   cultivation and five livestock   from China’s agricultural sector decreased from  poultry manure in China increased from
                                             guidelines; manure   categories (cattle, sheep, swine,   24.27 to 22.17 million tons. Methane emissions  2.04 million tons in 2018 to 2.26 million tons
                                             management system   poultry) via enteric fermentation and  from livestock and poultry manure decreased by  in 2022
                                             proportions based on   manure management    4.00 million tons between 2010 and 2016 [47]
                                             provincial data
                            [26]
                4  Xu et al., 2024  Livestock manure  Emission factors from IPCC   Methane emissions from enteric   Methane emissions from China's livestock   Assuming 10% methane collection, methane
                                             (2006) Tier 1, China’s   fermentation and manure   industry decreased from 13.85 million tons in   emissions from livestock manure in China
                                             Provincial GHG Inventory   management       2001 to 11.82 million tons in 2021. Methane   were estimated at 2.24 million tons in 2021
                                             Guidelines, and other                       emissions from manure management increased
                                             literature                                  from 1.76 to 1.92 million tons over the same
                                                                                         period, with an average annual emission of 1.95
                                                                                                [26]
                                                                                         million tons
                              [50]
                5  Wang et al., 2021  Livestock   Localized parameters from   Methane emissions from rice   Regions with high methane emissions from   The provinces with the highest methane
                                management,   China’s Provincial GHG   cultivation, livestock enteric   livestock management are primarily located in   emissions from livestock and poultry
                                straw burning,   Inventory Guidelines; straw-  fermentation/manure management,   western China, while regions with high   farming are Henan, Hunan, and Sichuan.
                                waste disposal  to-grain ratios and straw   and waste treatment  emissions from waste disposal are concentrated  Methane emissions from waste disposal are
                                             burning rates from NDRC                     in large cities such as municipalities and   concentrated in populous provinces such as
                                             data                                        provincial capitals [50]       Guangdong and Henan
                            [51]
                6  Lu et al., 2024  Waste disposal,   Locally measured data in   All methane sources in Shandong   Total methane emissions in Shandong Province  From 2018 to 2022, total methane
                                sewage treatment,  Shandong Province   Province, including energy activities,   in 2020 were 1.71 million tons [51]  emissions from waste in Shandong Province
                                manure       prioritized; supplemented   agricultural activities, waste                 declined from 0.96 to 0.74 million tons
                                management   with literature data  treatment, and natural sources
               amendment. By contrast, most other studies emphasize methane emissions from rice paddies and the utilization of straw as a soil amendment. Such
               discrepancies in scope may introduce potential biases, which should be acknowledged in future research.

