


Page 14 - Read Online
P. 14
Page 10 of 17                   Zhang et al. Carbon Footprints 2025, 4, 36  https://dx.doi.org/10.20517/cf.2025.29


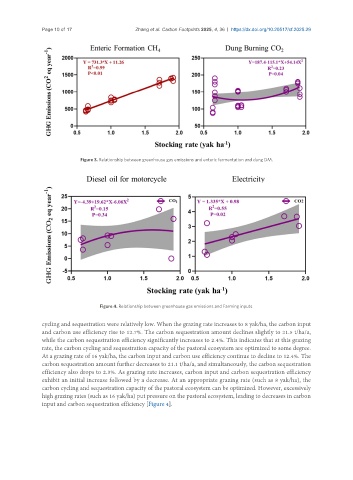
                            Figure 3. Relationship between greenhouse gas emissions and enteric fermentation and dung DM.


                                   Figure 4. Relationship between greenhouse gas emissions and Farming inputs.

               cycling and sequestration were relatively low. When the grazing rate increases to 8 yak/ha, the carbon input
               and carbon use efficiency rise to 12.7%. The carbon sequestration amount declines slightly to 21.5 t/ha/a,
               while the carbon sequestration efficiency significantly increases to 2.4%. This indicates that at this grazing
               rate, the carbon cycling and sequestration capacity of the pastoral ecosystem are optimized to some degree.
               At a grazing rate of 16 yak/ha, the carbon input and carbon use efficiency continue to decline to 12.4%. The
               carbon sequestration amount further decreases to 21.1 t/ha/a, and simultaneously, the carbon sequestration
               efficiency also drops to 2.3%. As grazing rate increases, carbon input and carbon sequestration efficiency
               exhibit an initial increase followed by a decrease. At an appropriate grazing rate (such as 8 yak/ha), the
               carbon cycling and sequestration capacity of the pastoral ecosystem can be optimized. However, excessively
               high grazing rates (such as 16 yak/ha) put pressure on the pastoral ecosystem, leading to decreases in carbon
               input and carbon sequestration efficiency [Figure 4].

