


Page 10 - Read Online
P. 10
Page 6 of 17                    Zhang et al. Carbon Footprints 2025, 4, 36  https://dx.doi.org/10.20517/cf.2025.29

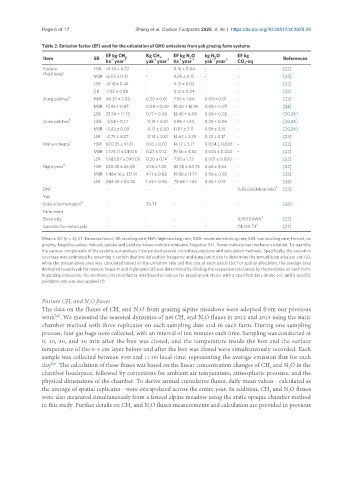
               Table 2. Emission factor (EF) used for the calculation of GHG emissions from yak grazing farm systems
                                     EF kg CH     Kg CH     EF kg N O   kg N O   EF kg
                Item             SR   -1   -1 4      -1  4  -1  -1  2 -1  -1 2  -1              References
                                     ha  year     yak  year  ha  year  yak  year  CO -eq
                                                                                   2
                Pasture          HSR -0.30 ± 0.72  -        0.16 ± 0.04  -       -              [22]
                (field level)
                                 MSR -2.03 ± 0.31  -        0.26 ± 0.15  -       -              [22]
                                 LSR  -0.18 ± 0.44  -       0.13 ± 0.03  -       -              [22]
                                 CK  -1.85 ± 0.38  -        0.12 ± 0.04  -       -              [22]
                        a
                Dung patches     HSR 40.37 ± 2.02  0.20 ± 0.01  7.93 ± 1.04  0.04 ± 0.01  -     [22]
                                 MSR 15.93 ± 0.87  0.08 ± 0.00  15.40 ± 14.96  0.08 ± 0.07  -   [22]
                                 LSR  33.34 ± 11.73  0.17 ± 0.06  12.45 ± 4.00  0.06 ± 0.02  -  [20,26]
                        b
                Urine patches    HSR -3.54 ± 0.17  -0.18 ± 0.01  5.96 ± 1.24  0.30 ± 0.06  -    [20,26]
                                 MSR -3.42 ± 0.09  -0.17 ± 0.00  11.87 ± 3.11  0.59 ± 0.15  -   [20,26]
                                 LSR  -2.75 ± 0.27  -0.14 ± 0.01  14.67 ± 3.35  0.73 ± 0.17  -  [22]
                Manure heaps c   HSR 600.35 ± 91.81  0.16 ± 0.03  14.12 ± 5.17  0.004 ± 0.003  -  [22]
                                 MSR 1,578.11 ± 240.16  0.27 ± 0.12  19.56 ± 4.02  0.003 ± 0.002  -  [22]
                                 LSR  1,983.07 ± 590.00  0.30 ± 0.14  7.50 ± 1.73  0.001 ± 0.000  -  [22]
                Night pens d     HSR 530.45 ± 26.08  3.56 ± 1.02  85.56 ± 64.76  0.62 ± 0.63  -  [22]
                                 MSR 1,484.10 ± 331.91  4.17 ± 0.68  19.56 ± 11.77  0.06 ± 0.03  -  [22]
                                 LSR  484.39 ± 24.02  1.43 ± 0.98  70.68 ± 1.43  0.20 ± 0.13  -  [22]
                DM                   -            -         -         -          0.85 (oxidation rate) f  [23]
                Yak
                            e
                Enteric fermentation  -           29.71     -         -          -              [26]
                Farm input
                                                                                         -1
                Electricity          -            -         -         -          0.9578 kWh     [27]
                Gasoline for motorcycle  -        -         -         -          74,100 TJ -1   [27]

               Mean ± SD (n = 3); EF: Emission factor; SR: stocking rate; HSR: high stocking rate; MSR: moderate stocking rate; LSR: low stocking rate; Fenced, no
               grazing. Negative values indicate uptake and positive values indicate emission. Negative CH  fluxes indicate net methane oxidation. To quantify
               the various components of the system, our analysis incorporated several critical assumptions and calculation methods. Specifically, the excretion
               coverage was estimated by assuming a certain daytime defecation frequency and dung patch size to determine the annual dung area per yak (a),
               while the annual urine area was calculated based on the urination rate and the size of each patch (b). For spatial allocation, the average area
               dedicated to each yak for manure heaps © and night pens (d) was determined by dividing the respective total areas by the herd size on each farm.
               Regarding emissions, the methane emission factor was based on values for growing yak steers with a specified daily intake (e), and a specific
               oxidation rate was also applied (f).


               Pasture CH  and N O fluxes
                               2
                         4
               The data on the fluxes of CH  and N O from grazing alpine meadows were adopted from our previous
                                         4
                                                2
               work . We measured the seasonal dynamics of net CH  and N O fluxes in 2012 and 2013 using the static
                   [22]
                                                               4
                                                                     2
               chamber method with three replicates on each sampling date and in each farm. During one sampling
               process, four gas bags were collected, with an interval of ten minutes each time. Sampling was conducted at
               0, 10, 20, and 30 min after the box was closed, and the temperature inside the box and the surface
               temperature of the 0-5 cm layer before and after the box was closed were simultaneously recorded. Each
               sample was collected between 9:00 and 11:00 local time, representing the average emission flux for each
               day . The calculation of these fluxes was based on the linear concentration changes of CH  and N O in the
                  [26]
                                                                                            4
                                                                                                  2
               chamber headspace, followed by corrections for ambient air temperature, atmospheric pressure, and the
               physical dimensions of the chamber. To derive annual cumulative fluxes, daily mean values - calculated as
               the average of spatial replicates - were extrapolated across the entire year. In addition, CH  and N O fluxes
                                                                                            4
                                                                                                  2
               were also measured simultaneously from a fenced alpine meadow using the static opaque chamber method
               in this study. Further details on CH  and N O fluxes measurements and calculation are provided in previous
                                                   2
                                             4

