


Page 11 - Read Online
P. 11
Zhang et al. Carbon Footprints 2025, 4, 36  https://dx.doi.org/10.20517/cf.2025.29  Page 7 of 17

                                    [22]
               work by Liu et al. (2017) .

               Enteric fermentation
               The CH  emission factor from yak enteric fermentation was calculated per yak using the results from
                      4
                              [26]
               Ding et al. (2010)  [Table 2]. The previous study used the sulphur hexafluoride tracer gas technique to
               measure the CH  output from 3-year-old growing yak steers (175 ± 10.7 kg), and reported that the daily CH 4
                             4
                                                          -1
                                                     -1
               emissions of the grazing yaks were 81.4 g day  yak  at an estimated daily grass dry matter intake of 3.78 kg.
               The average LWG was 43 kg yak  year  for a 3-year-old yak's one-year growth .
                                               -1
                                          -1
                                                                                 [27]
               Manure management
               Emissions of CH  and N O, along with their CO  equivalent, are attributed to the manure management
                                     2
                              4
                                                          2
               system, which covers yak night pens, manure heaps, and dung and urine patches from the dry stored
               manure combustion. The quantification of CH  and N O fluxes employed a hybrid methodology. Direct
                                                               2
                                                        4
               field-based quantification of emissions from night pens, manure heaps, and dung patches was undertaken
               over three seasonal periods (early, peak, and non-growing season) by means of the static chamber
               technique . In parallel, the flux estimates for urine patches were extrapolated from the established values
                       [20]
               reported by Yang et al. (2019) . Several assumptions are necessary to complete the inventory of GHG
                                         [24]
               balance of yak grazing farm systems for unity and computing the GHG sources. The night pen areas per yak
               equals the total night pen area divided by the number of yak in each farm. The average yak dung and urine
               rates were 3.6 and 8.5 times, respectively, during the daytime. The average size of a dung patch was 22 cm in
                                                                                            [28]
               diameter, and each 1.0 L urine sample formed a urine patch approximately 0.16 m  in size . Furthermore,
                                                                                     2
               we assumed that 60% of the excrement (dung and urine) was released during daytime grazing on the
               pasture, whereas the other 40% was released in the pens at night [29,30] . Dry stored yak manure is the major
               bio-energy source used by herders for cooking and heating; the methodology for determining CO 2
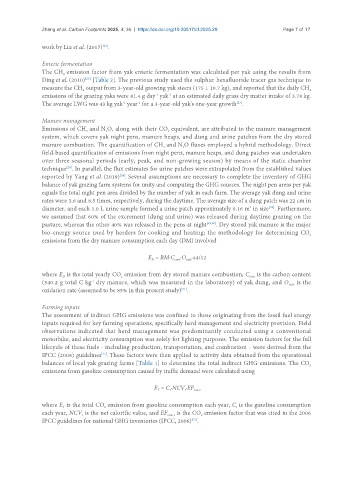
               emissions from the dry manure consumption each day (DM) involved
                                                   E  = BM·C ·O ·44/12
                                                    D
                                                            cont
                                                                rate
               where E  is the total yearly CO  emission from dry stored manure combustion, C  is the carbon content
                      D
                                                                                     cont
                                          2
                                -1
               (340.2 g total C kg  dry manure, which was measured in the laboratory) of yak dung, and O  is the
                                                                                                  rate
               oxidation rate (assumed to be 85% in this present study) .
                                                              [31]
               Farming inputs
               The assessment of indirect GHG emissions was confined to those originating from the fossil fuel energy
               inputs required for key farming operations, specifically herd management and electricity provision. Field
               observations indicated that herd management was predominantly conducted using a conventional
               motorbike, and electricity consumption was solely for lighting purposes. The emission factors for the full
               lifecycle of these fuels - including production, transportation, and combustion - were derived from the
               IPCC (2006) guidelines . These factors were then applied to activity data obtained from the operational
                                   [27]
               balances of local yak grazing farms [Table 1] to determine the total indirect GHG emissions. The CO 2
               emissions from gasoline consumption caused by traffic demand were calculated using


                                                     E  = C·NCV·EF co2-t
                                                               t
                                                      T
                                                          t
               where E  is the total CO  emission from gasoline consumption each year, C  is the gasoline consumption
                                                                                 t
                      T
                                    2
               each year, NCV  is the net calorific value, and EF  is the CO  emission factor that was cited in the 2006
                             t
                                                         co2-t
                                                                     2
               IPCC guidelines for national GHG inventories (IPCC, 2006) .
                                                                  [27]

