


Page 13 - Read Online
P. 13
Zhang et al. Carbon Footprints 2025, 4, 36  https://dx.doi.org/10.20517/cf.2025.29  Page 9 of 17


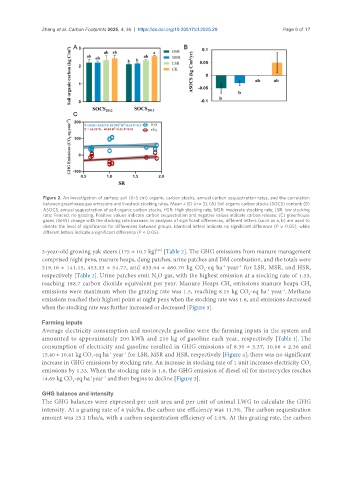
                Figure 2. An investigation of surface soil (0-5 cm) organic carbon stocks, annual carbon sequestration rates, and the correlation
                between greenhouse gas emissions and livestock stocking rates. Mean ± SD (n = 3); (A) Soil organic carbon stocks (SOCS) content; (B)
                ASOCS, annual sequestration of soil organic carbon stocks; HSR: High stocking rate; MSR: moderate stocking rate; LSR: low stocking
                rate; Fenced: no grazing. Positive values indicate carbon sequestration and negative values indicate carbon release; (C) greenhouse
                gases (GHG) change with the stocking rate increase. In analyses of significant differences, different letters (such as a, b) are used to
                denote the level of significance for differences between groups. Identical letters indicate no significant difference (P  >  0.05), while
                different letters indicate a significant difference (P < 0.05).


               3-year-old growing yak steers (175 ± 10.7 kg)  [Table 2]. The GHG emissions from manure management
                                                      [25]
               comprised night pens, manure heaps, dung patches, urine patches and DM combustion, and the totals were
               319.16 ± 141.15, 453.33 ± 54.77, and 833.94 ± 460.70 kg CO -eq ha  year  for LSR, MSR, and HSR,
                                                                            -1
                                                                                 -1
                                                                      2
               respectively [Table 2]. Urine patches emit N O gas, with the highest emission at a stocking rate of 1.33,
                                                      2
               reaching 188.7 carbon dioxide equivalent per year. Manure Heaps CH  emissions manure heaps CH
                                                                              4
                                                                                                         4
               emissions were maximum when the grazing rate was 1.5, reaching 8.15 kg CO -eq ha  year . Methane
                                                                                                -1
                                                                                           -1
                                                                                     2
               emissions reached their highest point at night pens when the stocking rate was 1.6, and emissions decreased
               when the stocking rate was further increased or decreased [Figure 3].
               Farming inputs
               Average electricity consumption and motorcycle gasoline were the farming inputs in the system and
               amounted to approximately 200 kWh and 210 kg of gasoline each year, respectively [Table 1]. The
               consumption of electricity and gasoline resulted in GHG emissions of 8.30 ± 3.37, 10.66 ± 2.36 and
               15.40 ± 10.41 kg CO -eq ha  year  for LSR, MSR and HSR, respectively [Figure 4]; there was no significant
                                      -1
                                           -1
                                2
               increase in GHG emissions by stocking rate. An increase in stocking rate of 1 unit increases electricity CO
                                                                                                         2
               emissions by 1.33. When the stocking rate is 1.6, the GHG emission of diesel oil for motorcycles reaches
               14.69 kg CO -eq ha year  and then begins to decline [Figure 3].
                                    -1
                               -1
                          2
               GHG balance and intensity
               The GHG balances were expressed per unit area and per unit of animal LWG to calculate the GHG
               intensity. At a grazing rate of 4 yak/ha, the carbon use efficiency was 11.3%. The carbon sequestration
               amount was 23.2 t/ha/a, with a carbon sequestration efficiency of 2.0%. At this grazing rate, the carbon

