


Page 18 - Read Online
P. 18
Page 14 of 22                     Hao et al. Carbon Footprints 2024;3:15  https://dx.doi.org/10.20517/cf.2024.24

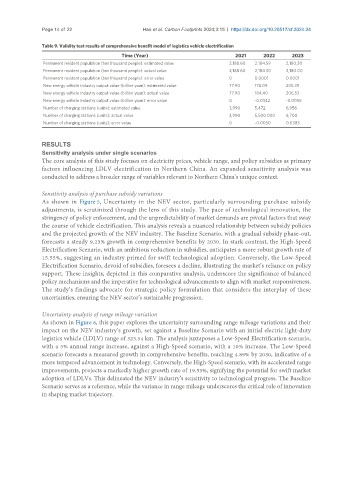
               Table 9. Validity test results of comprehensive benefit model of logistics vehicle electrification
                                          Time (Year)                           2021      2022     2023
                Permanent resident population (ten thousand people): estimated value  2,188.60  2,184.59  2,180.30
                Permanent resident population (ten thousand people): actual value  2,188.60  2,184.30  2,180.00
                Permanent resident population (ten thousand people): error value  0    0.0001    0.0001
                New energy vehicle industry output value (billion yuan): estimated value  77.90  178.09  205.39
                New energy vehicle industry output value (billion yuan): actual value  77.90  184.40  206.53
                New energy vehicle industry output value (billion yuan): error value  0  -0.0342  -0.0055
                Number of charging stations (units): estimated value          3,990    5,472     6,956
                Number of charging stations (units): actual value             3,990    5,500.000  6,700
                Number of charging stations (units): error value              0        -0.0050   0.0383


               RESULTS
               Sensitivity analysis under single scenarios
               The core analysis of this study focuses on electricity prices, vehicle range, and policy subsidies as primary
               factors influencing LDLV electrification in Northern China. An expanded sensitivity analysis was
               conducted to address a broader range of variables relevant to Northern China’s unique context.


               Sensitivity analysis of purchase subsidy variations
               As shown in Figure 5, Uncertainty in the NEV sector, particularly surrounding purchase subsidy
               adjustments, is scrutinized through the lens of this study. The pace of technological innovation, the
               stringency of policy enforcement, and the unpredictability of market demands are pivotal factors that sway
               the course of vehicle electrification. This analysis reveals a nuanced relationship between subsidy policies
               and the projected growth of the NEV industry. The Baseline Scenario, with a gradual subsidy phase-out,
               forecasts a steady 9.23% growth in comprehensive benefits by 2030. In stark contrast, the High-Speed
               Electrification Scenario, with an ambitious reduction in subsidies, anticipates a more robust growth rate of
               15.55%, suggesting an industry primed for swift technological adoption. Conversely, the Low-Speed
               Electrification Scenario, devoid of subsidies, foresees a decline, illustrating the market’s reliance on policy
               support. These insights, depicted in this comparative analysis, underscore the significance of balanced
               policy mechanisms and the imperative for technological advancements to align with market responsiveness.
               The study’s findings advocate for strategic policy formulation that considers the interplay of these
               uncertainties, ensuring the NEV sector’s sustainable progression.

               Uncertainty analysis of range mileage variation
               As shown in Figure 6, this paper explores the uncertainty surrounding range mileage variations and their
               impact on the NEV industry’s growth, set against a Baseline Scenario with an initial electric light-duty
               logistics vehicle (LDLV) range of 323.54 km. The analysis juxtaposes a Low-Speed Electrification scenario,
               with a 5% annual range increase, against a High-Speed scenario, with a 10% increase. The Low-Speed
               scenario forecasts a measured growth in comprehensive benefits, reaching 4.89% by 2030, indicative of a
               more tempered advancement in technology. Conversely, the High-Speed scenario, with its accelerated range
               improvements, projects a markedly higher growth rate of 19.53%, signifying the potential for swift market
               adoption of LDLVs. This delineated the NEV industry’s sensitivity to technological progress. The Baseline
               Scenario serves as a reference, while the variance in range mileage underscores the critical role of innovation
               in shaping market trajectory.

