


Page 16 - Read Online
P. 16
Page 12 of 22                     Hao et al. Carbon Footprints 2024;3:15  https://dx.doi.org/10.20517/cf.2024.24


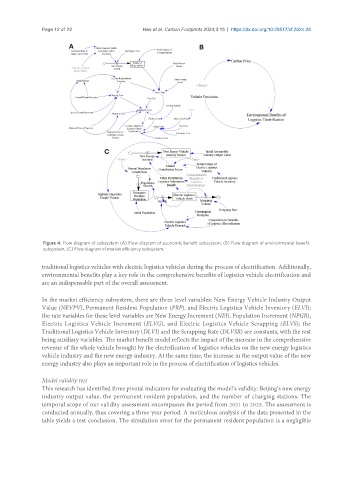
                Figure 4. Flow diagram of subsystem (A) Flow diagram of economic benefit subsystem, (B) Flow diagram of environmental benefit
                subsystem, (C) Flow diagram of market efficiency subsystem.

               traditional logistics vehicles with electric logistics vehicles during the process of electrification. Additionally,
               environmental benefits play a key role in the comprehensive benefits of logistics vehicle electrification and
               are an indispensable part of the overall assessment.

               In the market efficiency subsystem, there are three level variables: New Energy Vehicle Industry Output
               Value (NEVPV), Permanent Resident Population (PRP), and Electric Logistics Vehicle Inventory (ELVI);
               the rate variables for these level variables are New Energy Increment (NEI), Population Increment (NPGR),
               Electric Logistics Vehicle Increment (ELVG), and Electric Logistics Vehicle Scrapping (ELVS); the
               Traditional Logistics Vehicle Inventory (DLVI) and the Scrapping Rate (DLVSR) are constants, with the rest
               being auxiliary variables. The market benefit model reflects the impact of the increase in the comprehensive
               revenue of the whole vehicle brought by the electrification of logistics vehicles on the new energy logistics
               vehicle industry and the new energy industry. At the same time, the increase in the output value of the new
               energy industry also plays an important role in the process of electrification of logistics vehicles.

               Model validity test
               This research has identified three pivotal indicators for evaluating the model’s validity: Beijing’s new energy
               industry output value, the permanent resident population, and the number of charging stations. The
               temporal scope of our validity assessment encompasses the period from 2021 to 2023. The assessment is
               conducted annually, thus covering a three-year period. A meticulous analysis of the data presented in the
               table yields a test conclusion. The simulation error for the permanent resident population is a negligible

