


Page 13 - Read Online
P. 13
Hao et al. Carbon Footprints 2024;3:15  https://dx.doi.org/10.20517/cf.2024.24   Page 9 of 22

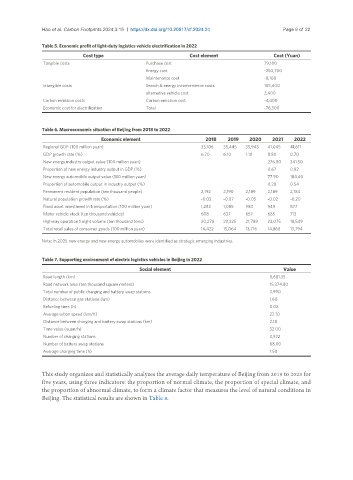
               Table 5. Economic profit of light-duty logistics vehicle electrification in 2022
                             Cost type                           Cost element                Cost (Yuan)
                Tangible costs                    Purchase cost                           79,100
                                                  Energy cost                             -250,700
                                                  Maintenance cost                        -8,100
                intangible costs                  Search & energy inconvenience costs     105,400
                                                  alternative vehicle cost                2,400
                Carbon emission costs             Carbon emission cost                    -4,400
                Economic cost for electrification  Total                                  -76,300


               Table 6. Macroeconomic situation of Beijing from 2018 to 2022
                                   Economic element                   2018    2019   2020    2021   2022
                Regional GDP (100 million yuan)                      33,106  35,445  35,943  41,045  41,611
                GDP growth rate (%)                                  6.70   6.10    1.10   8.80    0.70
                New energy industry output value (100 million yuan)                        276.80  341.50
                Proportion of new energy industry output in GDP (%)                        0.67    0.82
                New energy automobile output value (100 million yuan)                      77.90   184.40
                Proportion of automobile output in industry output (%)                     0.28    0.54
                Permanent resident population (ten thousand people)  2,192  2,190   2,189  2,189   2,184
                Natural population growth rate (%)                   -0.03  -0.07   -0.05  -0.02   -0.20
                Fixed asset investment in transportation (100 million yuan)  1,283  1,085  983  949  877
                Motor vehicle stock (ten thousand vehicles)          608    637     657    685     713
                Highway operation freight volume (ten thousand tons)  20,278  22,325  21,789  23,075  18,549
                Total retail sales of consumer goods (100 million yuan)  14,422  15,064  13,716  14,868  13,794
               Note: In 2021, new energy and new energy automobiles were identified as strategic emerging industries.


               Table 7. Supporting environment of electric logistics vehicles in Beijing in 2022
                                                Social element                                   Value
                Road length (km)                                                            8,681.35
                Road network area (ten thousand square meters)                              15,374.80
                Total number of public charging and battery swap stations                   3,990
                Distance between gas stations (km)                                          1.60
                Refueling time (h)                                                          0.08
                Average urban speed (km/h)                                                  22.10
                Distance between charging and battery swap stations (km)                    2.18
                Time value (yuan/h)                                                         32.00
                Number of charging stations                                                 3,922
                Number of battery swap stations                                             68.00
                Average charging time (h)                                                   1.50


               This study organizes and statistically analyzes the average daily temperature of Beijing from 2019 to 2023 for
               five years, using three indicators: the proportion of normal climate, the proportion of special climate, and
               the proportion of abnormal climate, to form a climate factor that measures the level of natural conditions in
               Beijing. The statistical results are shown in Table 8.

