


Page 77 - Read Online
P. 77
Page 10 of 16                      Hu et al. Carbon Footprints 2024;3:16  https://dx.doi.org/10.20517/cf.2024.28

               Table 3. Spatial spillover effects of the impact of industrial park construction on city carbon emissions
                                               ETDZ               EIDP                 LCIP
                Nabour                         -0.1742***         -0.1439***           0.6860***
                                               (0.0447)           (0.0140)             (0.0265)
                Park                           -1.3279***         -0.3949***           0.2384***
                                               (0.0707)           (0.0450)             (0.0628)
                Constant                       2.5202***          1.5870***            0.9528***
                                               (0.1880)           (0.1945)             (0.1910)
                N                              4284               4284                 4284
                CONTROL                        Y                  Y                    Y
                City fixed effects             Y                  Y                    Y
                Time fixed effects             Y                  Y                    Y
                2
                R                              0.4986             0.4986               0.5004
               ***P < 0.01. The values in parentheses are standard errors.


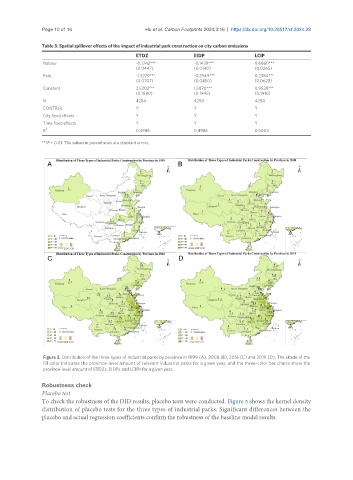
                Figure 2. Distribution of the three types of industrial parks by province in 1999 (A), 2008 (B), 2016 (C) and 2019 (D). The shade of the
                fill color indicates the province-level amount of relevant industrial parks for a given year, and the three-color bar charts show the
                province-level amount of ETDZs, EIDPs and LCIPs for a given year.


               Robustness check
               Placebo test
               To check the robustness of the DID results, placebo tests were conducted. Figure 5 shows the kernel density
               distribution of placebo tests for the three types of industrial parks. Significant differences between the
               placebo and actual regression coefficients confirm the robustness of the baseline model results.

