


Page 72 - Read Online
P. 72
Hu et al. Carbon Footprints 2024;3:16  https://dx.doi.org/10.20517/cf.2024.28    Page 5 of 16


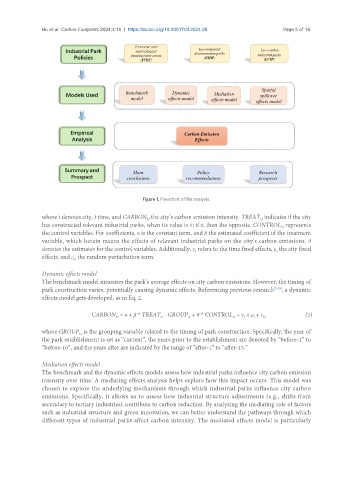
                                                 Figure 1. Flowchart of the analysis.

               where i denotes city, t time, and CARBON  the city’s carbon emission intensity. TREAT  indicates if the city
                                                                                         i,t
                                                   i,t
               has constructed relevant industrial parks, when its value is 1; if 0, then the opposite. CONTROL  represents
                                                                                                i,t
               the control variables. For coefficients, α is the constant term, and β the estimated coefficient of the treatment
               variable, which herein means the effects of relevant industrial parks on the city’s carbon emissions. θ
               denotes the estimates for the control variables. Additionally, γ refers to the time fixed effects, μ the city fixed
                                                                   t
                                                                                              i
               effects, and ε  the random perturbation term.
                          i,t
               Dynamic effects model
               The benchmark model measures the park’s average effects on city carbon emissions. However, the timing of
               park construction varies, potentially causing dynamic effects. Referencing previous research [7,18] , a dynamic
               effects model gets developed, as in Eq. 2.

                                CARBON  = α + β * TREAT  · GROUP  + θ * CONTROL  + γ + μ + ε                            (2)
                                                                i,t
                                        i,t
                                                       i,t
                                                                                       i
                                                                               i,t
                                                                                   t
                                                                                          i,t
               where GROUP  is the grouping variable related to the timing of park construction. Specifically, the year of
                            i,t
               the park establishment is set as “current”, the years prior to the establishment are denoted by “before-1” to
               “before-10”, and the years after are indicated by the range of “after-1” to “after-15.”
               Mediation effects model
               The benchmark and the dynamic effects models assess how industrial parks influence city carbon emission
               intensity over time. A mediating effects analysis helps explore how this impact occurs. This model was
               chosen to explore the underlying mechanisms through which industrial parks influence city carbon
               emissions. Specifically, it allows us to assess how industrial structure adjustments (e.g., shifts from
               secondary to tertiary industries) contribute to carbon reduction. By analyzing the mediating role of factors
               such as industrial structure and green innovation, we can better understand the pathways through which
               different types of industrial parks affect carbon intensity. The mediated effects model is particularly

