


Page 76 - Read Online
P. 76
Hu et al. Carbon Footprints 2024;3:16  https://dx.doi.org/10.20517/cf.2024.28    Page 9 of 16

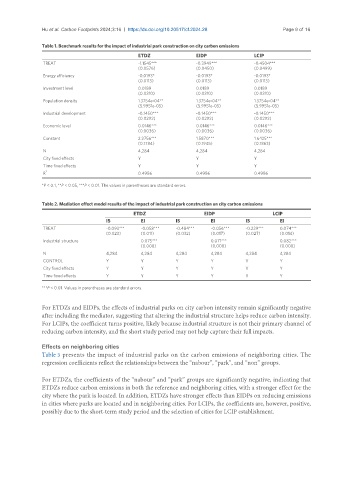
               Table 1. Benchmark results for the impact of industrial park construction on city carbon emissions
                                                ETDZ               EIDP                LCIP
                TREAT                           -1.1545***         -0.3949***          -0.4504***
                                                (0.0576)           (0.0450)            (0.0499)
                Energy efficiency               -0.0193*           -0.0193*            -0.0193*
                                                (0.0113)           (0.0113)            (0.0113)
                Investment level                0.0189             0.0189              0.0189
                                                (0.0310)           (0.0310)            (0.0310)
                Population density              1.3754e-04**       1.3754e-04**        1.3754e-04**
                                                (5.9951e-05)       (5.9951e-05)        (5.9951e-05)
                Industrial development          -0.1450***         -0.1450***          -0.1450***
                                                (0.0292)           (0.0292)            (0.0292)
                Economic level                  0.0146***          0.0146***           0.0146***
                                                (0.0036)           (0.0036)            (0.0036)
                Constant                        2.2756***          1.5870***           1.6425***
                                                (0.1784)           (0.1945)            (0.1863)
                N                               4,284              4,284               4,284
                City fixed effects              Y                  Y                   Y
                Time fixed effects              Y                  Y                   Y
                2
                R                               0.4986             0.4986              0.4986
               *P < 0.1, **P < 0.05, ***P < 0.01. The values in parentheses are standard errors.

               Table 2. Mediation effect model results of the impact of industrial park construction on city carbon emissions
                                              ETDZ                    EIDP                   LCIP
                                     IS          EI         IS          EI          IS         EI
                TREAT                -0.093***   -0.058***   -0.484***   -0.056***   -0.229***   0.074***
                                     (0.023)     (0.011)    (0.032)     (0.017)     (0.027)    (0.014)
                Industrial structure             0.075***               0.071***               0.082***
                                                 (0.008)                (0.008)                (0.008)
                N                    4,284       4,284      4,284       4,284       4,284      4,284
                CONTROL              Y           Y          Y           Y           Y          Y
                City fixed effects   Y           Y          Y           Y           Y          Y
                Time fixed effects   Y           Y          Y           Y           Y          Y
               ***P < 0.01. Values in parentheses are standard errors.


               For ETDZs and EIDPs, the effects of industrial parks on city carbon intensity remain significantly negative
               after including the mediator, suggesting that altering the industrial structure helps reduce carbon intensity.
               For LCIPs, the coefficient turns positive, likely because industrial structure is not their primary channel of
               reducing carbon intensity, and the short study period may not help capture their full impacts.

               Effects on neighboring cities
               Table 3 presents the impact of industrial parks on the carbon emissions of neighboring cities. The
               regression coefficients reflect the relationships between the “nabour”, “park”, and “non” groups.

               For ETDZs, the coefficients of the “nabour” and “park” groups are significantly negative, indicating that
               ETDZs reduce carbon emissions in both the reference and neighboring cities, with a stronger effect for the
               city where the park is located. In addition, ETDZs have stronger effects than EIDPs on reducing emissions
               in cities where parks are located and in neighboring cities. For LCIPs, the coefficients are, however, positive,
               possibly due to the short-term study period and the selection of cities for LCIP establishment.

