


Page 79 - Read Online
P. 79
Page 12 of 16                      Hu et al. Carbon Footprints 2024;3:16  https://dx.doi.org/10.20517/cf.2024.28

               Table 4. Excluding special sample test analysis of the impact of industrial park construction on city carbon emissions
                                           ETDZ                    EIDP                     LCIP
                                  Before     After       Before      After       Before       After
                TREAT             -1.1545***   -1.1515***   -0.3949***   -0.3942***   -0.4504***   -0.4504***
                                  (0.0576)   (0.0591)    (0.0450)    (0.0452)    (0.0499)     (0.0499)
                Constant          2.2756***   2.3426***   1.5870***   1.5895***   1.6425***   1.6425***
                                  (0.1784)   (0.1900)    (0.1945)    (0.1992)    (0.1863)     (0.1863)
                N                 4,284      4,284       4,284       4,284       4,284        4,284
                CONTROL           Y          Y           Y           Y           Y            Y
                City fixed effects  Y        Y           Y           Y           Y            Y
                Time fixed effects  Y        Y           Y           Y           Y            Y
                2
                R                 0.4986     0.4899      0.4986      0.4956      0.4986       0.4986
               ***P < 0.01. The values in parentheses are standard errors.


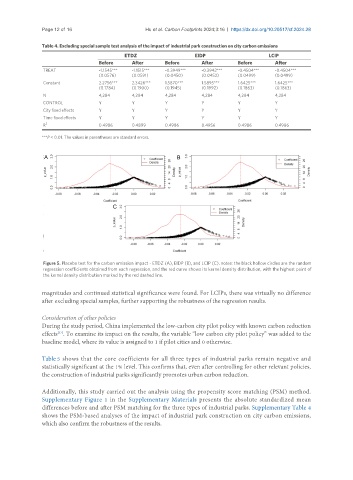
                Figure 5. Placebo test for the carbon emission impact - ETDZ (A), EIDP (B), and LCIP (C). notes: the black hollow circles are the random
                regression coefficients obtained from each regression, and the red curve shows its kernel density distribution, with the highest point of
                the kernel density distribution marked by the red dashed line.

               magnitudes and continued statistical significance were found. For LCIPs, there was virtually no difference
               after excluding special samples, further supporting the robustness of the regression results.


               Consideration of other policies
               During the study period, China implemented the low-carbon city pilot policy with known carbon reduction
               effects . To examine its impact on the results, the variable “low carbon city pilot policy” was added to the
                    [37]
               baseline model, where its value is assigned to 1 if pilot cities and 0 otherwise.


               Table 5 shows that the core coefficients for all three types of industrial parks remain negative and
               statistically significant at the 1% level. This confirms that, even after controlling for other relevant policies,
               the construction of industrial parks significantly promotes urban carbon reduction.


               Additionally, this study carried out the analysis using the propensity score matching (PSM) method.
               Supplementary Figure 1 in the Supplementary Materials presents the absolute standardized mean
               differences before and after PSM matching for the three types of industrial parks. Supplementary Table 4
               shows the PSM-based analyses of the impact of industrial park construction on city carbon emissions,
               which also confirm the robustness of the results.

