


Page 78 - Read Online
P. 78
Hu et al. Carbon Footprints 2024;3:16  https://dx.doi.org/10.20517/cf.2024.28   Page 11 of 16


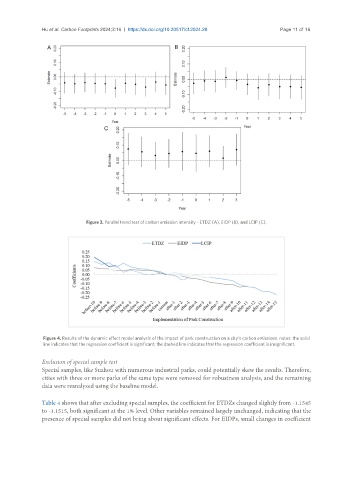
                              Figure 3. Parallel trend test of carbon emission intensity - ETDZ (A), EIDP (B), and LCIP (C).


                Figure 4. Results of the dynamic effect model analysis of the impact of park construction on a city’s carbon emissions. notes: the solid
                line indicates that the regression coefficient is significant; the dashed line indicates that the regression coefficient is insignificant.

               Exclusion of special sample test
               Special samples, like Suzhou with numerous industrial parks, could potentially skew the results. Therefore,
               cities with three or more parks of the same type were removed for robustness analysis, and the remaining
               data were reanalyzed using the baseline model.


               Table 4 shows that after excluding special samples, the coefficient for ETDZs changed slightly from -1.1545
               to -1.1515, both significant at the 1% level. Other variables remained largely unchanged, indicating that the
               presence of special samples did not bring about significant effects. For EIDPs, small changes in coefficient

