


Page 44 - Read Online
P. 44
Cheng et al. Carbon Footprints 2024;3:10  https://dx.doi.org/10.20517/cf.2023.53   Page 9 of 13


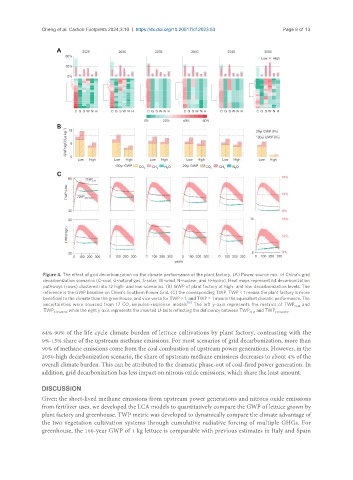
                Figure 4. The effect of grid decarbonization on the climate performance of the plant factory. (A) Power source mix  of China’s grid
                decarbonization scenarios (C-coal, G-natural gas, S-solar, W-wind, N-nuclear, and H-hydro). Heat maps represent 64 decarbonization
                pathways (rows) clustered into 12 high- and low-scenarios. (B) GWP of plant factory at high- and low-decarbonization levels. The
                reference is the GWP baseline on China’s Southern Power Grid. (C) the corresponding TWP. TWP < 1 means the plant factory is more
                beneficial to the climate than the greenhouse, and vice versa for TWP > 1, and TWP = 1 means the equivalent climatic performance. The
                uncertainties  were  sourced  from  17  CO   impulse-response  models [16] . The  left  y-axis  represents  the  metrics  of  TWP CH4   and
                                            2
                TWP CH4+N2O , while the right y-axis represents the inverted U-belts reflecting the deficiency between TWP CH4  and TWP CH4+N2O .

               84%-90% of the life cycle climate burden of lettuce cultivations by plant factory, contrasting with the
               9%-15% share of the upstream methane emissions. For most scenarios of grid decarbonization, more than
               90% of methane emissions come from the coal combustion of upstream power generations. However, in the
               2050-high decarbonization scenario, the share of upstream methane emissions decreases to about 4% of the
               overall climate burden. This can be attributed to the dramatic phase-out of coal-fired power generation. In
               addition, grid decarbonization has less impact on nitrous oxide emissions, which share the least amount.

               DISCUSSION
               Given the short-lived methane emissions from upstream power generations and nitrous oxide emissions
               from fertilizer uses, we developed the LCA models to quantitatively compare the GWP of lettuce grown by
               plant factory and greenhouse. TWP metric was developed to dynamically compare the climate advantage of
               the two vegetation cultivation systems through cumulative radiative forcing of multiple GHGs. For
               greenhouse, the 100-year GWP of 1 kg lettuce is comparable with previous estimates in Italy and Spain

