


Page 40 - Read Online
P. 40
Cheng et al. Carbon Footprints 2024;3:10  https://dx.doi.org/10.20517/cf.2023.53   Page 5 of 13

                                                                 [23]
               affecting the climate performance of the lettuce cultivations . During sensitivity analysis, we set deviations
               of the target variable as ± 5% and ± 20%, respectively, while keeping other input parameters as constants or
               unchanged. The results of sensitivity analysis for the two lettuce cultivation systems are presented in Section
               “Sensitivity analysis for LCA models”. Uncertainties in building the LCA model source from background
               and foreground data, such as electricity inputs and nitrous oxide emissions. Referring to the IPCC
                                                              [24]
               Guidelines for National Greenhouse Gas Inventories , we conducted the Monte Carlo simulation by
               defining the probability as a triangle distribution for random sampling, which is built in the OpenLCA
               software. Thus, uncertainties from multiple parameters were then propagated, accumulated, and quantified.

               Scenario analysis
               We developed the LCA models using electricity from China’s Southern Grid as a baseline. Then, we
               examined the climate performances of plant factory cultivations by using seven pure power sources: coal
               (P1), natural gas (P2), oil (P3), solar (P4), wind (P5), nuclear (P6), and hydropower (P7). Additionally,
               considering China’s grid transition for decarbonization, we also reviewed 64 grid decarbonization pathways
               from openly published literature and official reports [Supplementary Table 5]. Accordingly, from 2025 to
               2050, coal-fired power generation will decline from 60% to 38%, while the share of wind and solar power
               will rise and reach 80% of the total electricity sources [Supplementary Table 6]. According to the percentage
               of coal-fired power in China’s grid, we generated 12 low and high decarbonization scenarios of China's
               future power grid by cluster analysis, which were further used as inputs to LCA models to examine the
               climate performance of plant factory cultivation under Chinese grid decarbonization. These results are
               presented in Section "Grid decarbonization effect on plant factory’s performance".


               Technology warming potential
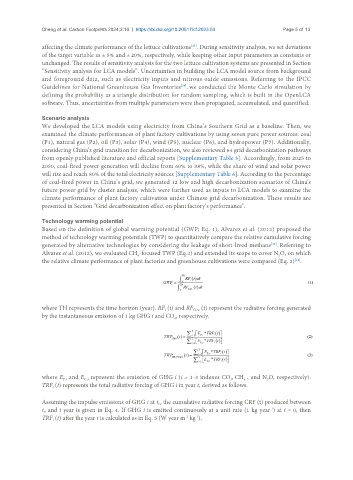
               Based on the definition of global warming potential (GWP; Eq. 1), Alvarez et al. (2012) proposed the
               method of technology warming potentials (TWP) to quantitatively compare the relative cumulative forcing
                                                                                            [14]
               generated by alternative technologies by considering the leakage of short-lived methane . Referring to
               Alvarez et al. (2012), we evaluated CH -focused TWP (Eq.2) and extended its scope to cover N O, on which
                                               4
                                                                                               2
                                                                                                    [14]
               the relative climate performance of plant factories and greenhouse cultivations were compared (Eq. 3) .


               where TH represents the time horizon (year). RF (t) and RF  (t) represent the radiative forcing generated
                                                         i
                                                                  CO2
               by the instantaneous emission of 1 kg GHG i and CO , respectively.
                                                            2


               where E  and E  represent the emission of GHG i (i = 1-3 indexes CO , CH  , and N O, respectively).
                                                                               2
                                                                                   4
                      P,i
                             G,i
                                                                                           2
               TRF (t) represents the total radiative forcing of GHG i in year t, derived as follows.
                   i
               Assuming the impulse emissions of GHG i at t , the cumulative radiative forcing CRF (t) produced between
                                                      E
                                                                                            -1
               t  and t year is given in Eq. 4. If GHG i is emitted continuously at a unit rate (1 kg year ) at t = 0, then
                E
               TRF (t) after the year t is calculated as in Eq. 5 (W year m  kg ).
                                                                   -1
                                                               -2
                   i

