


Page 42 - Read Online
P. 42
Cheng et al. Carbon Footprints 2024;3:10  https://dx.doi.org/10.20517/cf.2023.53   Page 7 of 13


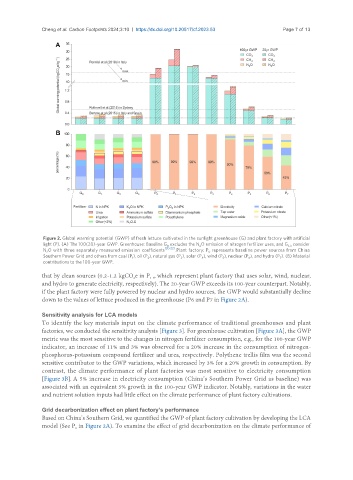
                Figure 2. Global warming potential (GWP) of fresh lettuce cultivated in the sunlight greenhouse (G) and plant factory with artificial
                light (P). (A) The 100(20)-year GWP. Greenhouse: Baseline G  excludes the N O emission of nitrogen fertilizer uses, and G  consider
                                                         0          2                             1-3
                N O with three separately measured emission  coefficients [20-22] . Plant factory: P  represents baseline power sources from China
                                                                       0
                 2
                Southern Power Grid and others from coal (P ), oil (P ), natural gas (P ), solar (P ), wind (P ), nuclear (P ), and hydro (P ). (B) Material
                                                                                     6
                                              1
                                                                                               7
                                                                            5
                                                              3
                                                   2
                                                                     4
                contributions to the 100-year GWP.
               that by clean sources (0.2-1.2 kgCO e in P , which represent plant factory that uses solar, wind, nuclear,
                                              2
                                                    4-7
               and hydro to generate electricity, respectively). The 20-year GWP exceeds its 100-year counterpart. Notably,
               if the plant factory were fully powered by nuclear and hydro sources, the GWP would substantially decline
               down to the values of lettuce produced in the greenhouse (P6 and P7 in Figure 2A).
               Sensitivity analysis for LCA models
               To identify the key materials input on the climate performance of traditional greenhouses and plant
               factories, we conducted the sensitivity analysis [Figure 3]. For greenhouse cultivation [Figure 3A], the GWP
               metric was the most sensitive to the changes in nitrogen fertilizer consumption, e.g., for the 100-year GWP
               indicator, an increase of 11% and 3% was observed for a 20% increase in the consumption of nitrogen-
               phosphorus-potassium compound fertilizer and urea, respectively. Polythene trellis film was the second
               sensitive contributor to the GWP variations, which increased by 3% for a 20% growth in consumption. By
               contrast, the climate performance of plant factories was most sensitive to electricity consumption
               [Figure 3B]. A 5% increase in electricity consumption (China’s Southern Power Grid as baseline) was
               associated with an equivalent 5% growth in the 100-year GWP indicator. Notably, variations in the water
               and nutrient solution inputs had little effect on the climate performance of plant factory cultivations.


               Grid decarbonization effect on plant factory’s performance
               Based on China’s Southern Grid, we quantified the GWP of plant factory cultivation by developing the LCA
               model (See P  in Figure 2A). To examine the effect of grid decarbonization on the climate performance of
                          0

