


Page 39 - Read Online
P. 39
Page 4 of 13                    Cheng et al. Carbon Footprints 2024;3:10  https://dx.doi.org/10.20517/cf.2023.53


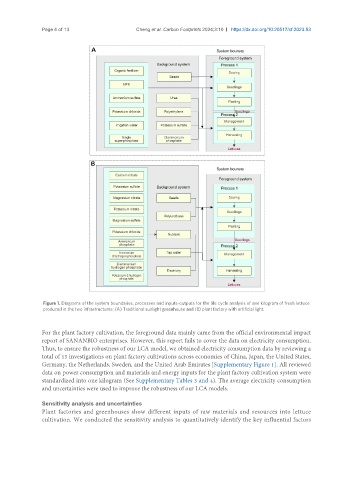
                Figure 1. Diagrams of the system boundaries, processes and inputs-outputs for the life cycle analysis of one kilogram of fresh lettuce
                produced in the two infrastructures: (A) Traditional sunlight greenhouse and (B) plant factory with artificial light.


               For the plant factory cultivation, the foreground data mainly came from the official environmental impact
               report of SANANBIO enterprises. However, this report fails to cover the data on electricity consumption.
               Thus, to ensure the robustness of our LCA model, we obtained electricity consumption data by reviewing a
               total of 15 investigations on plant factory cultivations across economies of China, Japan, the United States,
               Germany, the Netherlands, Sweden, and the United Arab Emirates [Supplementary Figure 1]. All reviewed
               data on power consumption and materials and energy inputs for the plant factory cultivation system were
               standardized into one kilogram (See Supplementary Tables 3 and 4). The average electricity consumption
               and uncertainties were used to improve the robustness of our LCA models.

               Sensitivity analysis and uncertainties
               Plant factories and greenhouses show different inputs of raw materials and resources into lettuce
               cultivation. We conducted the sensitivity analysis to quantitatively identify the key influential factors

