


Page 43 - Read Online
P. 43
Page 8 of 13                    Cheng et al. Carbon Footprints 2024;3:10  https://dx.doi.org/10.20517/cf.2023.53


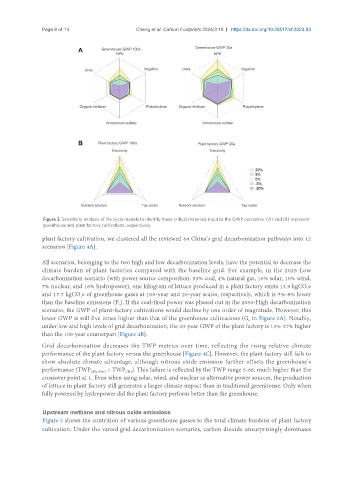
                Figure 3. Sensitivity analysis of life cycle models to identify these critical materials input to the GWP outcomes. (A) and (B) represent
                greenhouse and plant factory cultivations, respectively.
               plant factory cultivation, we clustered all the reviewed 64 China’s grid decarbonization pathways into 12
               scenarios [Figure 4A].

               All scenarios, belonging to the two high and low decarbonization levels, have the potential to decrease the
               climate burden of plant factories compared with the baseline grid. For example, in the 2025-Low
               decarbonization scenario (with power source composition: 53% coal, 4% natural gas, 10% solar, 10% wind,
               7% nuclear, and 16% hydropower), one kilogram of lettuce produced in a plant factory emits 13.9 kgCO e
                                                                                                        2
               and 17.7 kgCO e of greenhouse gases at 100-year and 20-year scales, respectively, which is 7%-8% lower
                            2
               than the baseline emissions (P ). If the coal-fired power was phased out in the 2050-High decarbonization
                                         0
               scenario, the GWP of plant-factory cultivations would decline by one order of magnitude. However, this
               lower GWP is still five times higher than that of the greenhouse cultivations (G  in Figure 2A). Notably,
                                                                                     0
               under low and high levels of grid decarbonization, the 20-year GWP of the plant factory is 13%-27% higher
               than the 100-year counterpart [Figure 4B].
               Grid decarbonization decreases the TWP metrics over time, reflecting the rising relative climate
               performance of the plant factory versus the greenhouse [Figure 4C]. However, the plant factory still fails to
               show absolute climate advantage, although nitrous oxide emission further offsets the greenhouse’s
               performance (TWP CH4+N2O  < TWP ). This failure is reflected by the TWP range 5-66, much higher than the
                                           CH4
               crossover point at 1. Even when using solar, wind, and nuclear as alternative power sources, the production
               of lettuce in plant factory still generates a larger climate impact than in traditional greenhouse. Only when
               fully powered by hydropower did the plant factory perform better than the greenhouse.


               Upstream methane and nitrous oxide emissions
               Figure 5 shows the contrition of various greenhouse gasses to the total climate burdens of plant factory
               cultivation. Under the varied grid decarbonization scenarios, carbon dioxide unsurprisingly dominates

