
Page 141 - Read Online
P. 141
Page 8 of 18 Wang et al. Cancer Drug Resist. 2026;9:8
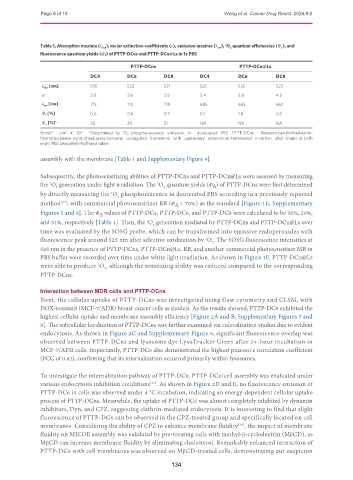
Table 1. Absorption maxima (λ abs ), molar extinction coefficients (ε), emission maxima (λ em ), O 2 quantum efficiencies (Φ Δ ), and
1
fluorescence quantum yields (Φ F ) of PTTP-DCns and PTTP-DCn@Ls in 1x PBS
PTTP-DCns PTTP-DCn@Ls
DC4 DC6 DC8 DC4 DC6 DC8
λ abs [nm] 518 522 521 522 525 523
ε a 3.0 3.6 3.5 3.4 3.8 4.0
λ em [nm] 713 712 719 685 683 662
Φ F [%] 0.6 0.6 0.7 1.3 1.8 3.8
Φ Δ [%] b 30 29 31 NA NA NA
1
-1
4
b
a L·mol · cm -1 × 10 . Determined by O 2 phosphorescence emission in deuterated PBS. PTTP-DCns : Benzene-pyridothiadiazole-
thienothiophene-pyridothiadiazole-benzene conjugated framework with quaternary ammonium-terminated n-carbon alkyl chains at both
ends; PBS: phosphate-buffered saline.
assembly with the membrane [Table 1 and Supplementary Figure 4].
Subsequently, the photosensitizing abilities of PTTP-DCns and PTTP-DCn@Ls were assessed by measuring
the O generation under light irradiation. The O quantum yields (Φ ) of PTTP-DCns were first determined
1
1
Δ
2
2
by directly measuring the O phosphorescence in deuterated PBS according to a previously reported
1
2
method , with commercial photosensitizer RB (Φ ≈ 76%) as the standard [Figure 1E, Supplementary
[27]
Δ
Figures 5 and 6]. The Φ values of PTTP-DC4, PTTP-DC6, and PTTP-DC8 were calculated to be 30%, 29%,
Δ
and 31%, respectively [Table 1]. Then, the O generation mediated by PTTP-DCns and PTTP-DCn@Ls over
1
2
time was evaluated by the SOSG probe, which can be transformed into emissive endoperoxides with
fluorescence peak around 525 nm after selective oxidization by O . The SOSG fluorescence intensities at
1
2
525 nm in the presence of PTTP-DCns, PTTP-DCn@Ls, RB, and another commercial photosensitizer MB in
PBS buffer were recorded over time under white light irradiation. As shown in Figure 1F, PTTP-DCn@Ls
were able to produce O , although the sensitizing ability was reduced compared to the corresponding
1
2
PTTP-DCns.
Interaction between MDR cells and PTTP-DCns
Next, the cellular uptake of PTTP-DCns was investigated using flow cytometry and CLSM, with
DOX-resistant (MCF-7/ADR) breast cancer cells as models. As the results showed, PTTP-DC6 exhibited the
highest cellular uptake and membrane assembly efficiency [Figure 2A and B, Supplementary Figures 7 and
8]. The subcellular localization of PTTP-DCns was further examined via colocalization studies due to evident
endocytosis. As shown in Figure 2C and Supplementary Figure 9, significant fluorescence overlap was
observed between PTTP-DCns and lysosome dye LysoTracker Green after 24-hour incubation in
MCF-7/ADR cells. Importantly, PTTP-DC6 also demonstrated the highest pearson’s correlation coefficient
(PCC of 0.82), confirming that its internalization occurred primarily within lysosomes.
To investigate the internalization pathway of PTTP-DC6, PTTP-DC6/cell assembly was evaluated under
various endocytosis inhibition conditions . As shown in Figure 2D and E, no fluorescence emission of
[33]
PTTP-DC6 in cells was observed under 4 °C incubation, indicating an energy-dependent cellular uptake
process of PTTP-DCns. Meanwhile, the uptake of PTTP-DC6 was almost completely inhibited by dynamin
inhibitors, Dyn, and CPZ, suggesting clathrin-mediated endocytosis. It is interesting to find that slight
fluorescence of PTTP-DC6 can be observed in the CPZ-treated group and specifically located on cell
membranes. Considering the ability of CPZ to enhance membrane fluidity , the impact of membrane
[34]
fluidity on MICOE assembly was validated by pre-treating cells with methyl-β-cyclodextrin (MβCD), as
MβCD can increase membrane fluidity by eliminating cholesterol. Remarkably enhanced interaction of
PTTP-DC6 with cell membranes was observed on MβCD-treated cells, demonstrating our suspicion
134