
Page 144 - Read Online
P. 144
Wang et al. Cancer Drug Resist. 2026;9:8 Page 11 of 18
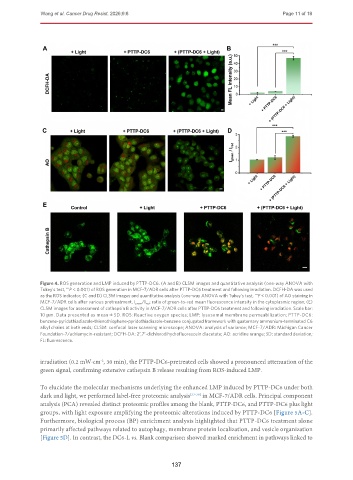
Figure 4. ROS generation and LMP induced by PTTP-DC6. (A and B) CLSM images and quantitative analysis (one-way ANOVA with
Tukey’s test, P < 0.001) of ROS generation in MCF-7/ADR cells after PTTP-DC6 treatment and following irradiation. DCFH-DA was used
***
as the ROS indicator; (C and D) CLSM images and quantitative analysis (one-way ANOVA with Tukey’s test, P < 0.001) of AO staining in
***
MCF-7/ADR cells after various pretreatment. I green /I red : ratio of green-to-red mean fluorescence intensity in the cytoplasmic region; (E)
CLSM images for assessment of cathepsin B activity in MCF-7/ADR cells after PTTP-DC6 treatment and following irradiation. Scale bar:
10 μm. Data presented as mean ± SD. ROS: Reactive oxygen species; LMP: lysosomal membrane permeabilization; PTTP-DC6:
benzene-pyridothiadiazole-thienothiophene-pyridothiadiazole-benzene conjugated framework with quaternary ammonium-terminated C6
alkyl chains at both ends; CLSM: confocal laser scanning microscope; ANOVA: analysis of variance; MCF-7/ADR: Michigan Cancer
Foundation-7/adriamycin-resistant; DCFH-DA: 2′,7′-dichlorodihydrofluorescein diacetate; AO: acridine orange; SD: standard deviation;
FL: fluorescence.
irradiation (0.2 mW·cm , 30 min), the PTTP-DC6-pretreated cells showed a pronounced attenuation of the
-2
green signal, confirming extensive cathepsin B release resulting from ROS-induced LMP.
To elucidate the molecular mechanisms underlying the enhanced LMP induced by PTTP-DC6 under both
dark and light, we performed label-free proteomic analysis [37-39] in MCF-7/ADR cells. Principal component
analysis (PCA) revealed distinct proteomic profiles among the blank, PTTP-DC6, and PTTP-DC6 plus light
groups, with light exposure amplifying the proteomic alterations induced by PTTP-DC6 [Figure 5A-C].
Furthermore, biological process (BP) enrichment analysis highlighted that PTTP-DC6 treatment alone
primarily affected pathways related to autophagy, membrane protein localization, and vesicle organization
[Figure 5D]. In contrast, the DC6-L vs. Blank comparison showed marked enrichment in pathways linked to
137