
Page 140 - Read Online
P. 140
Wang et al. Cancer Drug Resist. 2026;9:8 Page 7 of 18
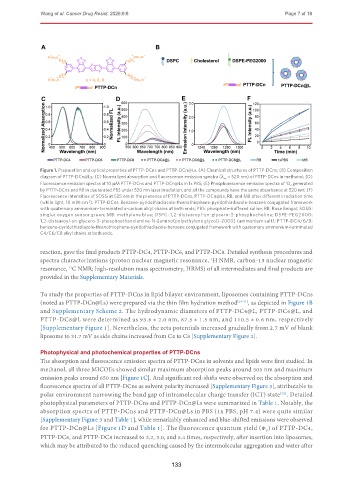
Figure 1. Preparation and optical properties of PTTP-DCns and PTTP-DCn@Ls. (A) Chemical structures of PTTP-DCns; (B) Composition
diagram of PTTP-DCn@Ls; (C) Normalized absorption and fluorescence emission spectra (λ ex = 520 nm) of PTTP-DCns in methanol; (D)
Fluorescence emission spectra of 10 µM PTTP-DCns and PTTP-DCn@Ls in 1x PBS; (E) Phosphorescence emission spectra of O 2 generated
1
by PTTP-DCns and RB in deuterated PBS under 520 nm laser irradiation, and all the compounds have the same absorbance at 520 nm; (F)
Fluorescence intensities of SOSG at 525 nm in the presence of PTTP-DCns, PTTP-DCn@Ls, RB, and MB after different irradiation time
(white light, 10 mW·cm ). PTTP-DCns: Benzene-pyridothiadiazole-thienothiophene-pyridothiadiazole-benzene conjugated framework
-2
with quaternary ammonium-terminated n-carbon alkyl chains at both ends; PBS: phosphate-buffered saline; RB: Rose Bengal; SOSG:
singlet oxygen sensor green; MB: methylene blue; DSPC: 1,2-distearoyl-sn-glycero-3-phosphocholine; DSPE-PEG2000:
1,2-distearoyl-sn-glycero-3-phosphoethanolamine-N-[amino(polyethylene glycol)-2000] (ammonium salt); PTTP-DC4/6/8:
benzene-pyridothiadiazole-thienothiophene-pyridothiadiazole-benzene conjugated framework with quaternary ammonium-terminated
C4/C6/C8 alkyl chains at both ends.
reaction, gave the final products PTTP-DC4, PTTP-DC6, and PTTP-DC8. Detailed synthesis procedures and
spectra characterizations (proton nuclear magnetic resonance, H NMR, carbon-13 nuclear magnetic
1
resonance, C NMR; high-resolution mass spectrometry, HRMS) of all intermediates and final products are
13
provided in the Supplementary Materials.
To study the properties of PTTP-DCns in lipid bilayer environment, liposomes containing PTTP-DCns
(noted as PTTP-DCn@Ls) were prepared via the thin film hydration method [29-31] , as depicted in Figure 1B
and Supplementary Scheme 2. The hydrodynamic diameters of PTTP-DC4@L, PTTP-DC6@L, and
PTTP-DC8@L were determined as 93.6 ± 2.0 nm, 87.5 ± 1.5 nm, and 110.5 ± 0.6 nm, respectively
[Supplementary Figure 1]. Nevertheless, the zeta potentials increased gradually from 2.7 mV of blank
liposome to 31.7 mV as side chains increased from C4 to C8 [Supplementary Figure 2].
Photophysical and photochemical properties of PTTP-DCns
The absorption and fluorescence emission spectra of PTTP-DCns in solvents and lipids were first studied. In
methanol, all three MICOEs showed similar maximum absorption peaks around 505 nm and maximum
emission peaks around 650 nm [Figure 1C]. And significant red-shifts were observed on the absorption and
fluorescence spectra of all PTTP-DCns as solvent polarity increased [Supplementary Figure 3], attributable to
polar environment narrowing the band gap of intramolecular charge transfer (ICT) state . Detailed
[32]
photophysical parameters of PTTP-DCns and PTTP-DCn@Ls were summarized in Table 1. Notably, the
absorption spectra of PTTP-DCns and PTTP-DCn@Ls in PBS (1x PBS, pH 7.4) were quite similar
[Supplementary Figure 3 and Table 1], while remarkably enhanced and blue-shifted emissions were observed
for PTTP-DCn@Ls [Figure 1D and Table 1]. The fluorescence quantum yield (Φ ) of PTTP-DC4,
F
PTTP-DC6, and PTTP-DC8 increased to 2.2, 3.0, and 5.4 times, respectively, after insertion into liposomes,
which may be attributed to the reduced quenching caused by the intermolecular aggregation and water after
133