
Page 246 - Read Online
P. 246
Cabral et al. Microstructures 2023;3:2023040 https://dx.doi.org/10.20517/microstructures.2023.39 Page 11 of 17
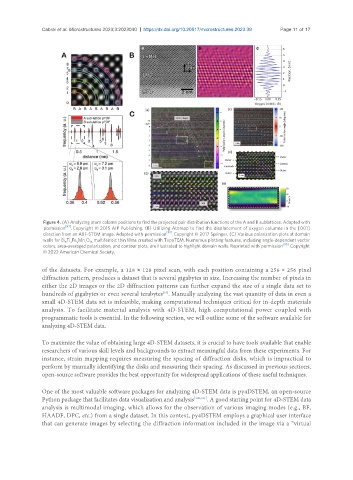
Figure 4. (A) Analyzing atom column positions to find the projected pair distribution functions of the A and B sublattices. Adapted with
permission [87] . Copyright © 2015 AIP Publishing. (B) Utilizing Atomap to find the displacement of oxygen columns in the [001]
direction from an ABF-STEM image. Adapted with permission [82] . Copyright © 2017 Springer. (C) Various polarization plots at domain
walls for Bi Ti Fe Mn O multiferroic thin films created with TopoTEM. Numerous plotting features, including angle-dependent vector
6
x
16
y
z
colors, area-averaged polarization, and contour plots, are illustrated to highlight domain walls. Reprinted with permission [95] . Copyright
© 2022 American Chemical Society.
of the datasets. For example, a 128 × 128 pixel scan, with each position containing a 256 × 256 pixel
diffraction pattern, produces a dataset that is several gigabytes in size. Increasing the number of pixels in
either the 2D images or the 2D diffraction patterns can further expand the size of a single data set to
hundreds of gigabytes or even several terabytes . Manually analyzing the vast quantity of data in even a
[19]
small 4D-STEM data set is infeasible, making computational techniques critical for in-depth materials
analysis. To facilitate material analysis with 4D-STEM, high computational power coupled with
programmatic tools is essential. In the following section, we will outline some of the software available for
analyzing 4D-STEM data.
To maximize the value of obtaining large 4D-STEM datasets, it is crucial to have tools available that enable
researchers of various skill levels and backgrounds to extract meaningful data from these experiments. For
instance, strain mapping requires measuring the spacing of diffraction disks, which is impractical to
perform by manually identifying the disks and measuring their spacing. As discussed in previous sections,
open-source software provides the best opportunity for widespread applications of these useful techniques.
One of the most valuable software packages for analyzing 4D-STEM data is py4DSTEM, an open-source
Python package that facilitates data visualization and analysis [100,101] . A good starting point for 4D-STEM data
analysis is multimodal imaging, which allows for the observation of various imaging modes (e.g., BF,
HAADF, DPC, etc.) from a single dataset. In this context, py4DSTEM employs a graphical user interface
that can generate images by selecting the diffraction information included in the image via a “virtual