
Page 238 - Read Online
P. 238
Cabral et al. Microstructures 2023;3:2023040 https://dx.doi.org/10.20517/microstructures.2023.39 Page 3 of 17
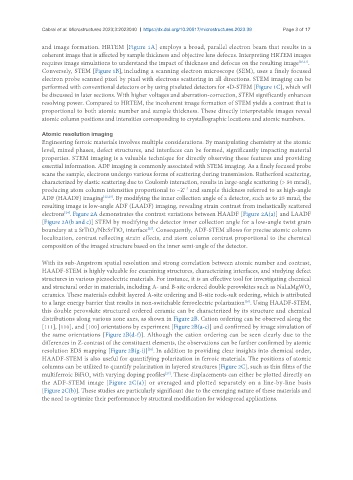
and image formation. HRTEM [Figure 1A] employs a broad, parallel electron beam that results in a
coherent image that is affected by sample thickness and objective lens defocus. Interpreting HRTEM images
requires image simulations to understand the impact of thickness and defocus on the resulting image [20,21] .
Conversely, STEM [Figure 1B], including a scanning electron microscope (SEM), uses a finely focused
electron probe scanned pixel by pixel with electrons scattering in all directions. STEM imaging can be
performed with conventional detectors or by using pixelated detectors for 4D-STEM [Figure 1C], which will
be discussed in later sections. With higher voltages and aberration-correction, STEM significantly enhances
resolving power. Compared to HRTEM, the incoherent image formation of STEM yields a contrast that is
proportional to both atomic number and sample thickness. These directly interpretable images reveal
atomic column positions and intensities corresponding to crystallographic locations and atomic numbers.
Atomic resolution imaging
Engineering ferroic materials involves multiple considerations. By manipulating chemistry at the atomic
level, mixed phases, defect structures, and interfaces can be formed, significantly impacting material
properties. STEM imaging is a valuable technique for directly observing these features and providing
essential information. ADF imaging is commonly associated with STEM imaging. As a finely focused probe
scans the sample, electrons undergo various forms of scattering during transmission. Rutherford scattering,
characterized by elastic scattering due to Coulomb interaction, results in large-angle scattering (> 50 mrad),
producing atom column intensities proportional to ~Z and sample thickness referred to as high-angle
1.7
ADF (HAADF) imaging [22,23] . By modifying the inner collection angle of a detector, such as to 25 mrad, the
resulting image is low-angle ADF (LAADF) imaging, revealing strain contrast from inelastically scattered
[24]
electrons . Figure 2A demonstrates the contrast variations between HAADF [Figure 2A(a)] and LAADF
[Figure 2A(b and c)] STEM by modifying the detector inner collection angle for a low-angle twist grain
boundary at a SrTiO /Nb:SrTiO interface . Consequently, ADF-STEM allows for precise atomic column
[25]
3
3
localization, contrast reflecting strain effects, and atom column contrast proportional to the chemical
composition of the imaged structure based on the inner semi-angle of the detector.
With its sub-Angstrom spatial resolution and strong correlation between atomic number and contrast,
HAADF-STEM is highly valuable for examining structures, characterizing interfaces, and studying defect
structures in various piezoelectric materials. For instance, it is an effective tool for investigating chemical
and structural order in materials, including A- and B-site ordered double perovskites such as NaLaMgWO
6
ceramics. These materials exhibit layered A-site ordering and B-site rock-salt ordering, which is attributed
to a large energy barrier that results in non-switchable ferroelectric polarization . Using HAADF-STEM,
[26]
this double perovskite structured ordered ceramic can be characterized by its structure and chemical
distributions along various zone axes, as shown in Figure 2B. Cation ordering can be observed along the
[111], [110], and [100] orientations by experiment [Figure 2B(a-c)] and confirmed by image simulation of
the same orientations [Figure 2B(d-f)]. Although the cation ordering can be seen clearly due to the
differences in Z-contrast of the constituent elements, the observations can be further confirmed by atomic
[26]
resolution EDS mapping [Figure 2B(g-i)] . In addition to providing clear insights into chemical order,
HAADF-STEM is also useful for quantifying polarization in ferroic materials. The positions of atomic
columns can be utilized to quantify polarization in layered structures [Figure 2C], such as thin films of the
[27]
multiferroic BiFiO with varying doping profiles . These displacements can either be plotted directly on
3
the ADF-STEM image [Figure 2C(a)] or averaged and plotted separately on a line-by-line basis
[Figure 2C(b)]. These studies are particularly significant due to the emerging nature of these materials and
the need to optimize their performance by structural modification for widespread applications.