
Page 207 - Read Online
P. 207
Guo et al. Microstructures 2023;3:2023038 https://dx.doi.org/10.20517/microstructures.2023.30 Page 19 of 30
Figure 11. The Pourbaix diagram of seawater simulated according to (A) thermodynamics and (B) kinetics. (Reproduced with
[53]
permission . Copyright 2000, The Royal Society of Chemistry).
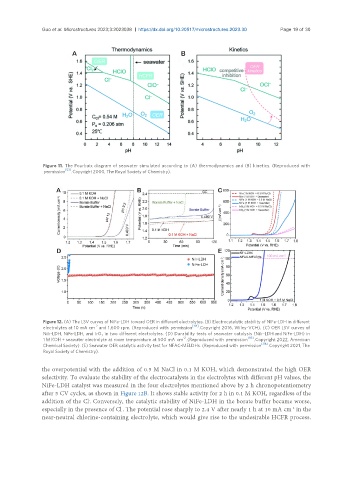
Figure 12. (A) The LSV curves of NiFe-LDH toward OER in different electrolytes. (B) Electrocatalytic stability of NiFe-LDH in different
-2
electrolytes at 10 mA cm and 1,600 rpm. (Reproduced with permission [114] . Copyright 2016, Wiley-VCH). (C) OER LSV curves of
NiIr-LDH, NiFe-LDH, and IrO in two different electrolytes. (D) Durability tests of seawater catalysis (NiIr-LDH and NiFe-LDH) in
2
-2
1 M KOH + seawater electrolyte at room temperature at 500 mA cm . (Reproduced with permission [115] . Copyright 2022, American
Chemical Society). (E) Seawater OER catalytic activity test for NFAC-MELDHs. (Reproduced with permission [116] . Copyright 2021, The
Royal Society of Chemistry).
the overpotential with the addition of 0.5 M NaCl in 0.1 M KOH, which demonstrated the high OER
selectivity. To evaluate the stability of the electrocatalysts in the electrolytes with different pH values, the
NiFe-LDH catalyst was measured in the four electrolytes mentioned above by 2 h chronopotentiometry
after 5 CV cycles, as shown in Figure 12B. It shows stable activity for 2 h in 0.1 M KOH, regardless of the
addition of the Cl . Conversely, the catalytic stability of NiFe-LDH in the borate buffer became worse,
-
especially in the presence of Cl . The potential rose sharply to 2.4 V after nearly 1 h at 10 mA cm in the
-2
-
near-neutral chlorine-containing electrolyte, which would give rise to the undesirable HCFR process.