
Page 205 - Read Online
P. 205
Bilovol et al. Relationship between atrial fibrillation, BMI and adipokines
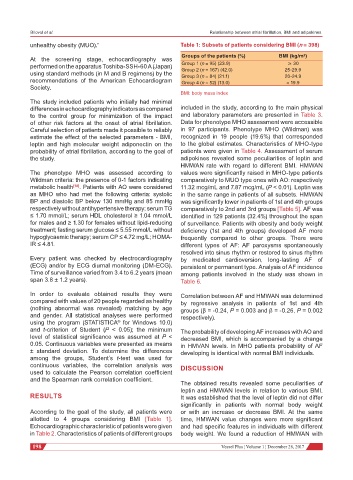
unhealthy obesity (MUO).” Table 1: Subsets of patients considering BMI (n = 398)
At the screening stage, echocardiography was Groups of the patients (%) BMI (kg/m²)
performed on the apparatus Toshiba-SSH-60 A (Japan) Group 1 (n = 95) (23.9) ≥ 30
using standard methods (in M and B regimens) by the Group 2 (n = 167) (42.0) 25-29.9
20-24.9
Group 3 (n = 84) (21.1)
recommendations of the American Echocardiogram Group 4 (n = 52) (13.0) < 19.9
Society.
BMI: body mass index
The study included patients who initially had minimal
differences in echocardiography indicators as compared included in the study, according to the main physical
to the control group for minimization of the impact and laboratory parameters are presented in Table 3.
of other risk factors at the onset of atrial fibrillation. Data for phenotype MHO assessment were accessible
Careful selection of patients made it possible to reliably in 97 participants. Phenotype MHO (Wildman) was
estimate the effect of the selected parameters - BMI, recognized in 19 people (19.6%) that corresponded
leptin and high molecular weight adiponectin on the to the global estimates. Characteristics of MHO-type
probability of atrial fibrillation, according to the goal of patients were given in Table 4. Assessment of serum
the study. adipokines revealed some peculiarities of leptin and
HMWAN rate with regard to different BMI. HMWAN
The phenotype MHO was assessed according to values were significantly raised in MHO-type patients
Wildman criteria: the presence of 0-1 factors indicating comparatively to MUO type ones with AO: respectively
metabolic health [18] . Patients with AO were considered 11.32 mcg/mL and 7.87 mcg/mL (P < 0.01). Leptin was
as MHO who had met the following criteria: systolic in the same range in patients of all subsets. HMWAN
BP and diastolic BP below 130 mmHg and 85 mmHg was significantly lower in patients of 1st and 4th groups
respectively without antihypertensive therapy; serum TG comparatively to 2nd and 3rd groups [Table 5]. AF was
≤ 1.70 mmol/L; serum HDL cholesterol ≥ 1.04 mmol/L identified in 129 patients (32.4%) throughout the span
for males and ≥ 1.30 for females without lipid-reducing of surveillance. Patients with obesity and body weight
treatment; fasting serum glucose ≤ 5.55 mmol/L without deficiency (1st and 4th groups) developed AF more
hypoglycaemic therapy; serum CP ≤ 4.72 mg/L; HOMA- frequently compared to other groups. There were
IR ≤ 4.81. different types of AF: AF paroxysms spontaneously
resolved into sinus rhythm or restored to sinus rhythm
Every patient was checked by electrocardiography by medicated cardioversion, long-lasting AF of
(ECG) and/or by ECG diurnal monitoring (DM-ECG). persistent or permanent type. Analysis of AF incidence
Time of surveillance varied from 3.4 to 6.2 years (mean among patients involved in the study was shown in
span 3.8 ± 1.2 years). Table 6.
In order to evaluate obtained results they were Correlation between AF and HMWAN was determined
compared with values of 20 people regarded as healthy by regressive analysis in patients of 1st and 4th
(nothing abnormal was revealed) matching by age groups (β = -0.24, Р = 0.003 and β = -0.26, Р = 0.002
and gender. All statistical analyses were performed respectively).
using the program (STATISTICA for Windows 10.0)
®
and t-criterion of Student (P < 0.05); the minimum The probability of developing AF increases with AO and
level of statistical significance was assumed at P < decreased BMI, which is accompanied by a change
0.05. Continuous variables were presented as means in HMVAN levels. In MHO patients probability of AF
± standard deviation. To determine the differences developing is identical with normal BMI individuals.
among the groups, Student’s t-test was used for
continuous variables, the correlation analysis was DISCUSSION
used to calculate the Pearson correlation coefficient
and the Spearman rank correlation coefficient.
The obtained results revealed some peculiarities of
leptin and HMWAN levels in relation to various BMI.
RESULTS It was established that the level of leptin did not differ
significantly in patients with normal body weight
According to the goal of the study, all patients were or with an increase or decrease BMI. At the same
allotted to 4 groups considering BMI [Table 1]. time, HMWAN value changes were more significant
Echocardiographic characteristic of patients were given and had specific features in individuals with different
in Table 2. Characteristics of patients of different groups body weight. We found a reduction of HMWAN with
198 Vessel Plus ¦ Volume 1 ¦ December 28, 2017