
Page 73 - Read Online
P. 73
Page 6 of 23 Rao. Vessel Plus 2022;6:24 https://dx.doi.org/10.20517/2574-1209.2021.91
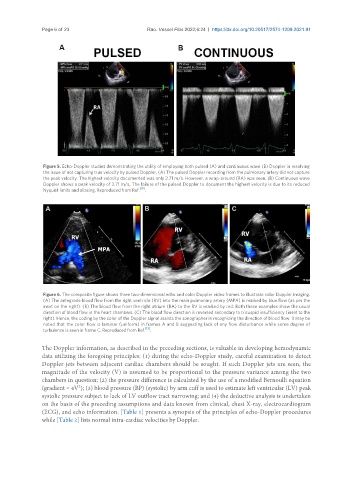
Figure 5. Echo-Doppler studies demonstrating the utility of employing both pulsed (A) and continuous wave (B) Doppler in resolving
the issue of not capturing true velocity by pulsed Doppler. (A) The pulsed Doppler recording from the pulmonary artery did not capture
the peak velocity. The highest velocity documented was only 2.71 m/s. However, a wrap-around (RA) was seen. (B) Continuous wave
Doppler shows a peak velocity of 3.71 m/s. The failure of the pulsed Doppler to document the highest velocity is due to its reduced
Nyquist limits and aliasing. Reproduced from Ref. [19] .
Figure 6. The composite figure shows three two-dimensional echo and color Doppler video frames to illustrate color Doppler imaging.
(A) The antegrade blood flow from the right ventricle (RV) into the main pulmonary artery (MPA) is marked by blue flow (as per the
inset on the right). (B) The blood flow from the right atrium (RA) to the RV is marked by red. Both these examples show the usual
direction of blood flow in the heart chambers. (C) The blood flow direction is reversed secondary to tricuspid insufficiency (inset to the
right). Hence, the coding by the color of the Doppler signal assists the sonographer in recognizing the direction of blood flow. It may be
noted that the color flow is laminar (uniform) in frames A and B suggesting lack of any flow disturbance while some degree of
[19]
turbulence is seen in frame C. Reproduced from Ref. .
The Doppler information, as described in the preceding sections, is valuable in developing hemodynamic
data utilizing the foregoing principles: (1) during the echo-Doppler study, careful examination to detect
Doppler jets between adjacent cardiac chambers should be sought. If such Doppler jets are seen, the
magnitude of the velocity (V) is assumed to be proportional to the pressure variance among the two
chambers in question; (2) the pressure difference is calculated by the use of a modified Bernoulli equation
(gradient = 4V²); (3) blood pressure (BP) (systolic) by arm cuff is used to estimate left ventricular (LV) peak
systolic pressure subject to lack of LV outflow tract narrowing; and (4) the deductive analysis is undertaken
on the basis of the preceding assumptions and data known from clinical, chest X-ray, electrocardiogram
(ECG), and echo information. [Table 1] presents a synopsis of the principles of echo-Doppler procedures
while [Table 2] lists normal intra-cardiac velocities by Doppler.