
Page 72 - Read Online
P. 72
Rao. Vessel Plus 2022;6:24 https://dx.doi.org/10.20517/2574-1209.2021.91 Page 5 of 23
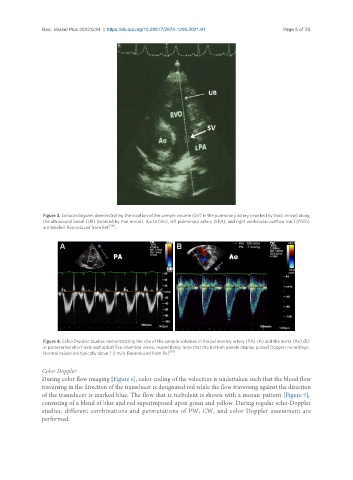
Figure 3. Echocardiogram demonstrating the location of the sample volume (SV) in the pulmonary artery (marked by thick arrow) along
the ultrasound beam (UB) (marked by thin arrow). Aorta (Ao), left pulmonary artery (LPA), and right ventricular outflow tract (RVO)
[19]
are labeled. Reproduced from Ref. .
Figure 4. Echo-Doppler studies demonstrating the site of the sample volumes in the pulmonary artery (PA) (A) and the aorta (Ao) (B)
in parasternal short-axis and apical five-chamber views, respectively; note that the bottom panels display pulsed Doppler recordings.
Normal values are typically about 1.0 m/s. Reproduced from Ref. [19] .
Color Doppler
During color flow imaging [Figure 6], color coding of the velocities is undertaken such that the blood flow
traversing in the direction of the transducer is designated red while the flow traversing against the direction
of the transducer is marked blue. The flow that is turbulent is shown with a mosaic pattern [Figure 7],
consisting of a blend of blue and red superimposed upon green and yellow. During regular echo-Doppler
studies, different combinations and permutations of PW, CW, and color Doppler assessment are
performed.