


Page 15 - Read Online
P. 15
Hsu et al. Vessel Plus 2021;5:2  I  http://dx.doi.org/10.20517/2574-1209.2020.45                                                     Page 9 of 12

               Table 3. Comparison of variables selected by different prognostic models in the literature
                                                                                                Performance
                Author (year)     Sample size  Outcome assessed   Variables included in the model
                                                                                                  (AUC)
                Counsell et al. [45]  (2002)  530  30-day mortality and   age, living alone, independence before stroke,   0.84-0.88
                                           six-month independent   verbal component of GCS, arm strength, ability to
                                           survival          walk
                Muscari et al. [46]  (2011)  211  9-month mRS  NIHSS, need of urinary catheter, oxygen   0.84
                                                             administration, upper limb paralysis
                Teale et al.  (2012)   27-8964  30-180 days functional   2-11 variables (age, NIHSS, limb weakness,   0.75-0.88
                       [8]
                review 17 models           assessment        dysarthria, conscious, diabetes, previous stroke,
                                                             fever, mRS, etc.)
                Wouters et al. [27]  (2018)  369  90 days mRS  Baseline-NIHSS, age, ischemic heart disease  0.86
                Jampathong et al. [25]    75-4441  90-365 days functional   1-11 variables (NIHSS, age, infarct volume,   0.73-0.84
                (2018) review 23 models    assessment        diabetes, previous stroke, pre-stroke disability,
                                                             small-vessel stroke, t-PA use, preadmission mRS,
                                                             sex, atrial fibrillation,..,etc.)
                Proposed model     37,094  90-day mRS        age, discharge mRS, discharge NIHSS, recurrent   0.95-0.96
                by LR method                                 ischemia, previous stroke, Barthel index (BI)-
                (This study)                                 grooming, BI-dressing, aspirin use

               NIHSS: National Institutes of Health Stroke Scale; AUCs: area under the curves

               smoking and drinking were not selected in our final prediction models [Figure 3]. The relationship between
               stroke outcomes and hospital distances, socioeconomic status, and timely treatment has been previously
               discussed in the literature . Our study suggested that patients treated at close by medical centers had
                                      [40]
               good outcomes, and so were those in the east part of Taiwan (rural countryside) with farther distance to
               the hospital, which may be associated with a younger population and smaller sample size, although further
               studies may be required to explain this effect.

               In our study, age of onset and previous CVA were found to be the most frequently selected predictors
               [Figure 2], which were consistent with previously reported studies, however, these two variables were
               non-modifiable factors which make them unusable for triage or treatment. Nevertheless, some variables
               selected in our models might provide useful guidance during the triage and for the treatment plan. For
               example, according to the coefficients of LR selected variables in different patient subgroups [Figure 3], the
               models for all patients at admission required fewer variables to achieve similar performance as those of
               all 140 variables used. In the case of the hemorrhagic patients, only two variables were selected that might
               occur due to the different natural courses and pathology between hemorrhagic and ischemic patients [34,35] .
               The negative coefficients of albumin and hemoglobin found in our study indicated higher values might
               improve stroke outcomes. On the contrary, the positive coefficients of white blood cells (WBC), fasting
               sugar, and heart rate provided warning signs to clinicians that these variables might be prone to poor
               outcomes. The negative coefficient of Aspirin prescribed as the discharge medication was also shown a
               positive effect in our discharge model of ischemic patients. The associations between stroke outcomes and
                                    [42]
                      [41]
               albumin , hemoglobin , and WBC  have been reported, but Aspirin prescription has not been shown
                                               [43]
                                           [44]
               as beneficial to stroke outcomes  as found in our current population study. For the potential optimal
               options of treatment, further evaluations on Aspirin were required for targeted interventions to prove its
               positive effort on the improvement of stroke outcomes. Furthermore, several imaging variables as shown in
               Supplemental Figure S2 including MRI no Finding (OR = 0.37), CT no Finding (OR = 0.62), MRI Lesion:
               Left subcortical MCA (OR = 1.58), MRI: Left brainstem (OR = 1.85), and MRI Lesion: Right brainstem (OR
               = 2.03), were selected in our admission prediction models. These clinical imaging findings can be used as
               early predictors and indicators for predicting stroke outcomes to alert and assist clinicians during triages of
               stroke patients.

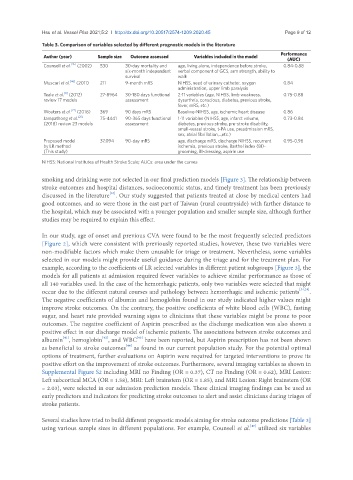
               Several studies have tried to build different prognostic models aiming for stroke outcome predictions [Table 3]
                                                                                     [45]
               using various sample sizes in different populations. For example, Counsell et al.  utilized six variables

