


Page 11 - Read Online
P. 11
Hsu et al. Vessel Plus 2021;5:2  I  http://dx.doi.org/10.20517/2574-1209.2020.45                                                     Page 5 of 12

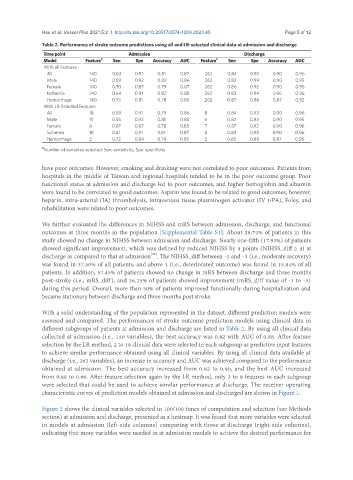
               Table 2. Performance of stroke outcome predictions using all and LR-selected clinical data at admission and discharge
                Time point                  Admission                              Discharge
                Model         Feature #  Sen   Spe   Accuracy  AUC   Feature #  Sen   Spe  Accuracy  AUC
                With all Features
                 All           140     0.63    0.91   0.81    0.87    262     0.84   0.93    0.90    0.96
                 Male          140     0.59   0.92    0.82    0.86    262     0.82   0.94    0.90    0.95
                 Female        140     0.70   0.87    0.79    0.87    262     0.86   0.92    0.90    0.96
                 Ischemia      140     0.64   0.91    0.82    0.88    262     0.83   0.94    0.90    0.96
                 Hemorrhage    140     0.75   0.81    0.78    0.85    262     0.87   0.86    0.87    0.92
                With LR-Selected Features
                 All           18      0.59   0.91    0.79    0.86    8       0.84   0.93    0.90    0.96
                 Male          11      0.55   0.92    0.81    0.85    6       0.82   0.93    0.90    0.95
                 Female        8       0.67   0.87    0.78    0.85    7       0.87   0.92    0.90    0.96
                 Ischemia      18      0.61   0.91    0.81    0.87    8       0.83   0.93    0.90    0.96
                 Hemorrhage    2       0.72   0.84    0.79    0.85    2       0.85   0.89    0.87    0.95
               # Number of variables selected; Sen: sensitivity; Spe: specificity

               have poor outcomes. However, smoking and drinking were not correlated to poor outcomes. Patients from
               hospitals in the middle of Taiwan and regional hospitals tended to be in the poor outcome group. Poor
               functional status at admission and discharge led to poor outcomes, and higher hemoglobin and albumin
               were found to be correlated to good outcomes. Aspirin was found to be related to good outcomes; however,
               heparin, intra-arterial (IA) thrombolysis, intravenous tissue plasminogen activator (IV t-PA), Foley, and
               rehabilitation were related to poor outcomes.

               We further evaluated the differences in NIHSS and mRS between admission, discharge, and functional
               outcomes at three months in the population [Supplemental Table S1]. About 28.74% of patients in this
               study showed no change in NIHSS between admission and discharge. Nearly one-fifth (17.93%) of patients
               showed significant improvement, which was defined by reduced NIHSS by 4 points (NIHSS_diff ≥ 4) at
                                                    [22]
               discharge as compared to that at admission . The NIHSS_diff between -1 and -3 (i.e., moderate recovery)
               was found in 37.50% of all patients, and above 1 (i.e., deteriorated outcome) was found in 15.84% of all
               patients. In addition, 57.45% of patients showed no change in mRS between discharge and three months
               post-stroke (i.e., mRS_diff), and 36.25% of patients showed improvement (mRS_diff value of -1 to -5)
               during this period. Overall, more than 50% of patients improved functionally during hospitalization and
               became stationary between discharge and three months post stroke.


               With a solid understanding of the population represented in the dataset, different prediction models were
               assessed and compared. The performances of stroke outcome prediction models using clinical data in
               different subgroups of patients at admission and discharge are listed in Table 2. By using all clinical data
               collected at admission (i.e., 140 variables), the best accuracy was 0.82 with AUC of 0.88. After feature
               selection by the LR method, 2 to 18 clinical data were selected in each subgroup as predictive input features
               to achieve similar performance obtained using all clinical variables. By using all clinical data available at
               discharge (i.e., 262 variables), an increase in accuracy and AUC was achieved compared to the performance
               obtained at admission. The best accuracy increased from 0.82 to 0.90, and the best AUC increased
               from 0.88 to 0.96. After feature selection again by the LR method, only 2 to 8 features in each subgroup
               were selected that could be used to achieve similar performance at discharge. The receiver operating
               characteristic curves of prediction models obtained at admission and discharged are shown in Figure 1.

               Figure 2 shows the clinical variables selected in 100/100 times of computation and selection (see Methods
               section) at admission and discharge, presented as a heatmap. It was found that more variables were selected
               in models at admission (left-side columns) comparing with those at discharge (right-side columns),
               indicating that more variables were needed in at admission models to achieve the desired performance for

