


Page 10 - Read Online
P. 10
Page 4 of 12                                                      Hsu et al. Vessel Plus 2021;5:2  I  http://dx.doi.org/10.20517/2574-1209.2020.45

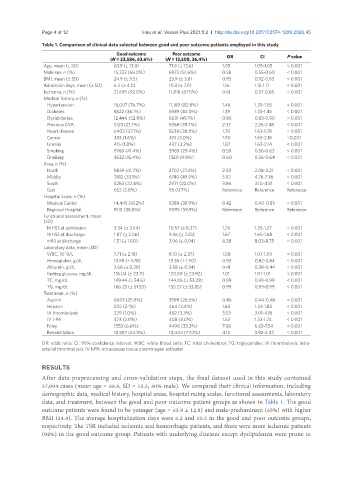
               Table 1. Comparison of clinical data selected between good and poor outcome patients employed in this study
                                        Good outcome       Poor outcome       OR         CI       P value
                                      (N = 23,586, 63.6%)  (N = 13,508, 36.4%)
                Age, mean (± SD)       63.9 (± 12.8)      71.8 (± 12.6)     1.05       1.05-1.05  < 0.001
                Male sex, n (%)        15,322 (65.0%)     6972 (51.6%)      0.58       0.55-0.60  < 0.001
                BMI, mean (± SD)       24.9 (± 3.5)       23.9 (± 3.8)      0.93       0.92-0.93  < 0.001
                Admission days, mean (± SD)  6.2 (± 4.0)  10.3 (± 7.0)      1.16       1.15-1.17  < 0.001
                Ischemia, n (%)        21,695 (92.0%)     11,816 (87.5%)    0.61       0.57-0.65  < 0.001
                Medical history, n (%)
                 Hypertension          18,097 (76.7%)     11,189 (82.8%)    1.46       1.39-1.55  < 0.001
                 Diabetes              8522 (36.1%)       5939 (44.0%)      1.39       1.33-1.45  < 0.001
                 Dyslipidemia          12,446 (52.8%)     6631 (49.1%)      0.86       0.83-0.90  < 0.001
                 Previous CVA          5123 (21.7%)       5358 (39.7%)      2.37       2.26-2.48  < 0.001
                 Heart disease         6402 (27.1%)       5238 (38.8%)      1.70       1.63-1.78  < 0.001
                 Cancer                383 (1.6%)         410 (3.0%)        1.90       1.65-2.18  <0.001
                 Uremia                415 (1.8%)         437 (3.2%)        1.87       1.63-2.14  < 0.001
                 Smoking               9760 (41.4%)       3969 (29.4%)      0.59       0.56-0.62  < 0.001
                 Drinking              3632 (15.4%)       1320 (9.8%)       0.60       0.56-0.64  < 0.001
                Area, n (%)
                 North                 9839 (41.7%)       3702 (27.4%)      2.58       2.08-3.21  < 0.001
                 Middle                7812 (33.1%)       6740 (49.9%)      5.92       4.76-7.36  < 0.001
                 South                 5283 (22.4%)       2971 (22.0%)      3.86       3.10-4.81  < 0.001
                 East                  652 (2.8%)         95 (0.7%)         Reference  Reference  Reference
                Hospital Scale, n (%)
                 Medical Center        14,445 (61.2%)     5389 (39.9%)      0.42       0.40-0.85  < 0.001
                 Regional Hospital     9141 (38.8%)       8095 (59.9%)      Reference  Reference  Reference
                Functional assessment, mean
                (SD)
                 NIHSS at admission    3.34 (± 3.64)      10.57 (± 8.37)    1.26       1.25-1.27  < 0.001
                 NIHSS at discharge    1.87 (± 2.06)      9.36 (± 7.43)     1.67       1.65-1.68  < 0.001
                 mRS at discharge      1.51 (± 1.00)      3.96 (± 0.94)     8.38       8.03-8.75  < 0.001
                Laboratory data, mean (SD)
                 WBC, 10^9/L           7.71 (± 2.18)      8.10 (± 2.37)     1.08       1.07-1.09  < 0.001
                 Hemoglobin, g/dL      13.98 (± 1.78)     13.35 (± 1.90)    0.83       0.82-0.84  < 0.001
                 Albumin, g/dL         3.66 (± 0.28)      3.58 (± 0.34)     0.41       0.38-0.44  < 0.001
                 Fasting glucose, mg/dL  116.04 (± 23.11)  120.50 (± 23.92)  1.01      1.01-1.01  < 0.001
                 TC, mg/dL             149.44 (± 54.6)    144.06 (± 53.28)  0.99       0.99-0.99  < 0.001
                 TG, mg/dL             166.23 (± 51.53)   155.27 (± 53.85)  0.99       0.99-0.99  < 0.001
                Treatment, n (%)
                 Aspirin               6093 (25.8%)       3599 (26.6%)      0.46       0.44-0.48  < 0.001
                 Heparin               505 (2.1%)         464 (3.4%)        1.63       1.43-1.85  < 0.001
                 IA thrombolysis       229 (1.0%)         452 (3.3%)        3.53       3.01-4.15  < 0.001
                 IV t-PA               473 (2.0%)         408 (3.0%)        1.52       1.33-1.74  < 0.001
                 Foley                 1553 (6.6%)        4496 (33.3%)      7.08       6.65-7.54  < 0.001
                 Rehabilitation        10,587 (44.9%)     10,404 (77.0%)    4.12       3.92-4.32  < 0.001

               OR: odds ratio; CI: 95% confidence interval; WBC: white blood cells; TC: total cholesterol; TG: triglycerides; IA thrombolysis: intra-
               arterial thrombolysis; IV t-PA: intravenous tissue plasminogen activator

               RESULTS
               After data preprocessing and cross-validation steps, the final dataset used in this study contained
               37,094 cases (mean age = 66.8, SD = 13.3, 60% male). We compared their clinical information, including
               demographic data, medical history, hospital areas, hospital rating scales, functional assessments, laboratory
               data, and treatment, between the good and poor outcome patient groups as shown in Table 1. The good
               outcome patients were found to be younger (age = 63.9 ± 12.8) and male-predominant (65%) with higher
               BMI (24.9). The average hospitalization days were 6.2 and 10.3 in the good and poor outcome groups,
               respectively. The TSR included ischemic and hemorrhagic patients, and there were more ischemic patients
               (92%) in the good outcome group. Patients with underlying diseases except dyslipidemia were prone to

