
Page 132 - Read Online
P. 132
Page 6 of 16 Xu et al. Soft Sci. 2025, 5, 43 https://dx.doi.org/10.20517/ss.2025.63
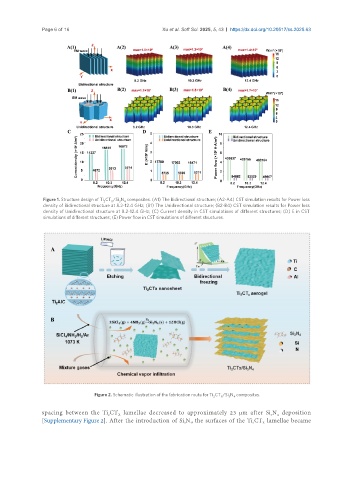
Figure 1. Structure design of Ti CT /Si N composites. (A1) The Bidirectional structure; (A2-A4) CST simulation results for Power loss
2 X 3 4
density of Bidirectional structure at 8.2-12.4 GHz; (B1) The Unidirectional structure; (B2-B4) CST simulation results for Power loss
density of Unidirectional structure at 8.2-12.4 GHz; (C) Current density in CST simulations of different structures; (D) E in CST
simulations of different structures; (E) Power flow in CST simulations of different structures.
Figure 2. Schematic illustration of the fabrication route for Ti CT /Si N composites.
X
4
2
3
spacing between the Ti CT lamellae decreased to approximately 23 μm after Si N deposition
4
3
X
2
[Supplementary Figure 2]. After the introduction of Si N , the surfaces of the Ti CT lamellae became
X
4
3
2