
Page 12 - Read Online
P. 12
Wu et al. Soft Sci 2024;4:42 https://dx.doi.org/10.20517/ss.2024.51 Page 9 of 13
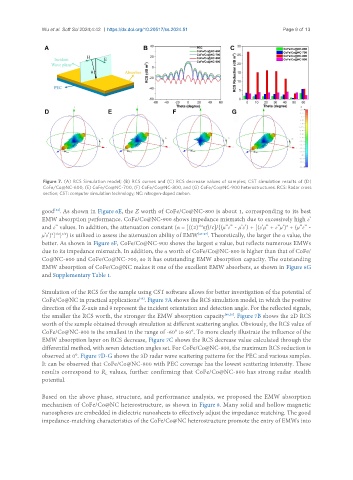
Figure 7. (A) RCS Simulation model; (B) RCS curves and (C) RCS decrease values of samples; CST simulation results of (D)
CoFe/Co@NC-600, (E) CoFe/Co@NC-700, (F) CoFe/Co@NC-800, and (G) CoFe/Co@NC-900 heterostructures. RCS: Radar cross
section; CST: computer simulation technology; NC: nitrogen-doped carbon.
good . As shown in Figure 6E, the Z worth of CoFe/Co@NC-800 is about 1, corresponding to its best
[44]
EMW absorption performance. CoFe/Co@NC-900 shows impedance mismatch due to excessively high ε’
1/2
2
and ε” values. In addition, the attenuation constant (α = [((2) πf)/c]/{(μ”ε” - μ’ε’) + [(ε’μ” + ε”μ’) + (μ”ε” -
μ’ε’) ] } ) is utilized to assess the attenuation ability of EMW [45-47] . Theoretically, the larger the α value, the
2 1/2 1/2
better. As shown in Figure 6F, CoFe/Co@NC-900 shows the largest α value, but reflects numerous EMWs
due to its impedance mismatch. In addition, the α worth of CoFe/Co@NC-800 is higher than that of CoFe/
Co@NC-600 and CoFe/Co@NC-700, so it has outstanding EMW absorption capacity. The outstanding
EMW absorption of CoFe/Co@NC makes it one of the excellent EMW absorbers, as shown in Figure 6G
and Supplementary Table 1.
Simulation of the RCS for the sample using CST software allows for better investigation of the potential of
CoFe/Co@NC in practical applications . Figure 7A shows the RCS simulation model, in which the positive
[48]
direction of the Z-axis and θ represent the incident orientation and detection angle. For the reflected signals,
the smaller the RCS worth, the stronger the EMW absorption capacity [49,50] . Figure 7B shows the 2D RCS
worth of the sample obtained through simulation at different scattering angles. Obviously, the RCS value of
CoFe/Co@NC-800 is the smallest in the range of -60° to 60°. To more clearly illustrate the influence of the
EMW absorption layer on RCS decrease, Figure 7C shows the RCS decrease value calculated through the
differential method, with seven detection angles set. For CoFe/Co@NC-800, the maximum RCS reduction is
observed at 0°. Figure 7D-G shows the 3D radar wave scattering patterns for the PEC and various samples.
It can be observed that CoFe/Co@NC-800 with PEC coverage has the lowest scattering intensity. These
results correspond to R values, further confirming that CoFe/Co@NC-800 has strong radar stealth
L
potential.
Based on the above phase, structure, and performance analysis, we proposed the EMW absorption
mechanism of CoFe/Co@NC heterostructure, as shown in Figure 8. Many solid and hollow magnetic
nanospheres are embedded in dielectric nanosheets to effectively adjust the impedance matching. The good
impedance-matching characteristics of the CoFe/Co@NC heterostructure promote the entry of EMWs into