
Page 10 - Read Online
P. 10
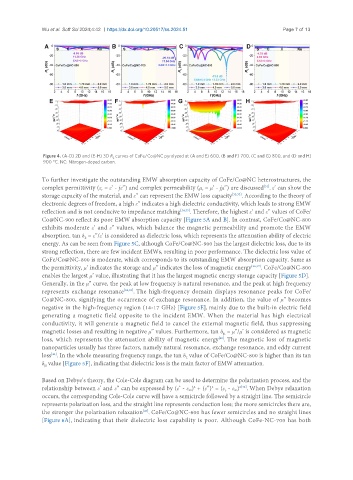
Wu et al. Soft Sci 2024;4:42  https://dx.doi.org/10.20517/ss.2024.51             Page 7 of 13


                Figure 4. (A-D) 2D and (E-H) 3D R  curves of CoFe/Co@NC pyrolyzed at (A and E) 600, (B and F) 700, (C and G) 800, and (D and H)
                                       L
                900 °C. NC: Nitrogen-doped carbon.

               To further investigate the outstanding EMW absorption capacity of CoFe/Co@NC heterostructures, the
               complex permittivity (ε  = ε’ - jε”) and complex permeability (μ  = μ’ - jμ”) are discussed . ε’ can show the
                                                                                          [31]
                                   r
                                                                     r
               storage capacity of the material, and ε” can represent the EMW loss capacity [32,33] . According to the theory of
               electronic degrees of freedom, a high ε” indicates a high dielectric conductivity, which leads to strong EMW
               reflection and is not conducive to impedance matching [34,35] . Therefore, the highest ε’ and ε” values of CoFe/
               Co@NC-900 reflect its poor EMW absorption capacity [Figure 5A and B]. In contrast, CoFe/Co@NC-800
               exhibits moderate ε’ and ε” values, which balance the magnetic permeability and promote the EMW
               absorption. tan δ  = ε”/ε’ is considered as dielectric loss, which represents the attenuation ability of electric
                              ε
               energy. As can be seen from Figure 5C, although CoFe/Co@NC-900 has the largest dielectric loss, due to its
               strong reflection, there are few incident EMWs, resulting in poor performance. The dielectric loss value of
               CoFe/Co@NC-800 is moderate, which corresponds to its outstanding EMW absorption capacity. Same as
               the permittivity, µ’ indicates the storage and µ” indicates the loss of magnetic energy [36,37] . CoFe/Co@NC-800
               enables the largest µ’ value, illustrating that it has the largest magnetic energy storage capacity [Figure 5D].
               Generally, in the μ” curve, the peak at low frequency is natural resonance, and the peak at high frequency
               represents exchange resonance [38,39] . The high-frequency domain displays resonance peaks for CoFe/
               Co@NC-800, signifying the occurrence of exchange resonance. In addition, the value of μ” becomes
               negative in the high-frequency region (14-17 GHz) [Figure 5E], mainly due to the built-in electric field
               generating a magnetic field opposite to the incident EMW. When the material has high electrical
               conductivity, it will generate a magnetic field to cancel the external magnetic field, thus suppressing
               magnetic losses and resulting in negative μ” values. Furthermore, tan δ  = μ”/μ’ is considered as magnetic
                                                                            μ
               loss, which represents the attenuation ability of magnetic energy . The magnetic loss of magnetic
                                                                           [40]
               nanoparticles usually has three factors, namely natural resonance, exchange resonance, and eddy current
               loss . In the whole measuring frequency range, the tan δ  value of CoFe/Co@NC-800 is higher than its tan
                  [41]
                                                                ε
               δ  value [Figure 5F], indicating that dielectric loss is the main factor of EMW attenuation.
                μ
               Based on Debye’s theory, the Cole-Cole diagram can be used to determine the polarization process, and the
                                                                  2
                                                                        2
                                                                                  2[42]
               relationship between ε’ and ε” can be expressed by (ε’ - ε )  + (ε”)  = (ε  - ε ) . When Debye relaxation
                                                                             s
                                                                                ∞
                                                                 ∞
               occurs, the corresponding Cole-Cole curve will have a semicircle followed by a straight line. The semicircle
               represents polarization loss, and the straight line represents conduction loss; the more semicircles there are,
               the stronger the polarization relaxation . CoFe/Co@NC-600 has fewer semicircles and no straight lines
                                                 [43]
               [Figure 6A], indicating that their dielectric loss capability is poor. Although CoFe-NC-700 has both