
Page 11 - Read Online
P. 11
Page 8 of 13 Wu et al. Soft Sci 2024;4:42 https://dx.doi.org/10.20517/ss.2024.51
Figure 5. (A) ε’, (B) ε”, (C) tan δ , (D) µ’, (E) µ”, and (F) tan δ values of the samples.
ε
μ
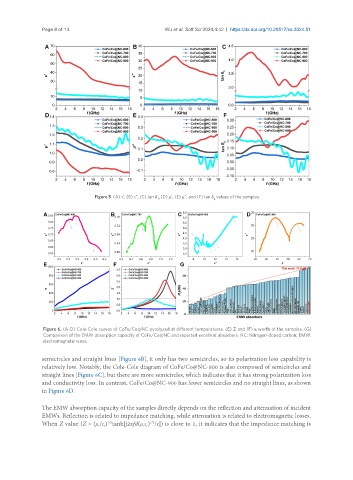
Figure 6. (A-D) Cole-Cole curves of CoFe/Co@NC pyrolyzed at different temperatures. (E) Z and (F) α worth of the samples. (G)
Comparison of the EMW absorption capacity of CoFe/Co@NC and reported excellent absorbers. NC: Nitrogen-doped carbon; EMW:
electromagnetic wave.
semicircles and straight lines [Figure 6B], it only has two semicircles, so its polarization loss capability is
relatively low. Notably, the Cole-Cole diagram of CoFe/Co@NC-800 is also composed of semicircles and
straight lines [Figure 6C], but there are more semicircles, which indicates that it has strong polarization loss
and conductivity loss. In contrast, CoFe/Co@NC-900 has fewer semicircles and no straight lines, as shown
in Figure 6D.
The EMW absorption capacity of the samples directly depends on the reflection and attenuation of incident
EMWs. Reflection is related to impedance matching, while attenuation is related to electromagnetic losses.
1/2
1/2
When Z value (Z = (μ /ε ) tanh|j2πfd(μ ε ) /c|) is close to 1, it indicates that the impedance matching is
r
r
r r