
Page 7 - Read Online
P. 7
Page 4 of 13 Wu et al. Soft Sci 2024;4:42 https://dx.doi.org/10.20517/ss.2024.51
Figure 1. Schematic diagram of the synthesis process and corresponding microstructure CoFe/Co@NC heterostructure. NC: Nitrogen-
doped carbon.
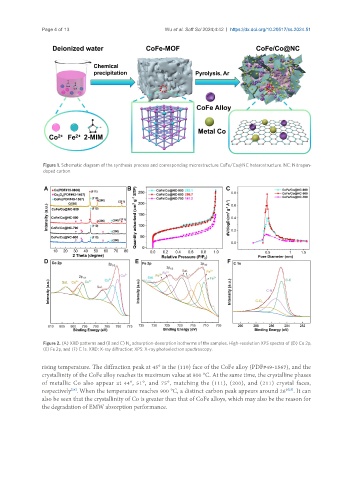
Figure 2. (A) XRD patterns and (B and C) N adsorption-desorption isotherms of the samples. High-resolution XPS spectra of (D) Co 2p,
2
(E) Fe 2p, and (F) C 1s. XRD: X-ray diffraction; XPS: X-ray photoelectron spectroscopy.
rising temperature. The diffraction peak at 45° is the (110) face of the CoFe alloy (PDF#49-1567), and the
crystallinity of the CoFe alloy reaches its maximum value at 800 °C. At the same time, the crystalline phases
of metallic Co also appear at 44°, 51°, and 75°, matching the (111), (200), and (211) crystal faces,
respectively . When the temperature reaches 900 °C, a distinct carbon peak appears around 26° . It can
[24]
[25]
also be seen that the crystallinity of Co is greater than that of CoFe alloys, which may also be the reason for
the degradation of EMW absorption performance.