
Page 93 - Read Online
P. 93
Page 4 of 21 Tang et al. Soft Sci. 2025, 5, 11 https://dx.doi.org/10.20517/ss.2024.62
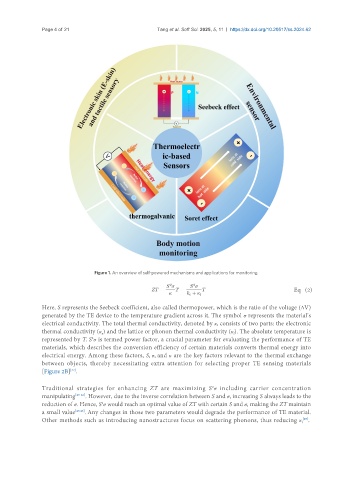
Figure 1. An overview of self-powered mechanisms and applications for monitoring.
Eq (2)
Here, S represents the Seebeck coefficient, also called thermopower, which is the ratio of the voltage (ΔV)
generated by the TE device to the temperature gradient across it. The symbol σ represents the material’s
electrical conductivity. The total thermal conductivity, denoted by κ, consists of two parts: the electronic
thermal conductivity (κ ) and the lattice or phonon thermal conductivity (κ). The absolute temperature is
e
l
represented by T. S σ is termed power factor, a crucial parameter for evaluating the performance of TE
2
materials, which describes the conversion efficiency of certain materials converts thermal energy into
electrical energy. Among these factors, S, σ, and κ are the key factors relevant to the thermal exchange
between objects, thereby necessitating extra attention for selecting proper TE sensing materials
[Figure 2B] .
[42]
Traditional strategies for enhancing ZT are maximizing S σ including carrier concentration
2
manipulating [43-46] . However, due to the inverse correlation between S and σ, increasing S always leads to the
reduction of σ. Hence, S σ would reach an optimal value of ZT with certain S and σ, making the ZT maintain
2
a small value [47,48] . Any changes in those two parameters would degrade the performance of TE material.
[49]
Other methods such as introducing nanostructures focus on scattering phonons, thus reducing κ .
l