
Page 75 - Read Online
P. 75
Luo et al. Soft Sci 2024;4:7 https://dx.doi.org/10.20517/ss.2023.40 Page 7 of 12
1/2
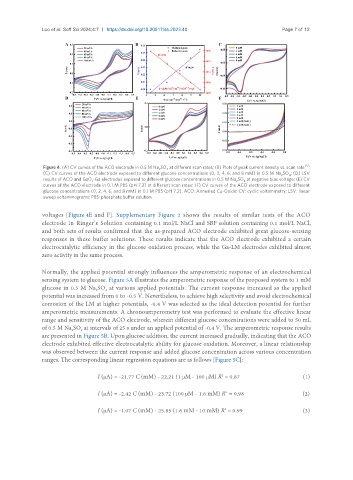
Figure 4. (A) CV curves of the ACO electrode in 0.5 M Na SO at different scan rates; (B) Plots of peak current density vs. scan rate ;
2 4
(C) CV curves of the ACO electrode exposed to different glucose concentrations (0, 2, 4, 6, and 8 mM) in 0.5 M Na SO ; (D) LSV
2 4
results of ACO and GaO -Ga electrodes exposed to different glucose concentrations in 0.5 M Na SO at negative bias voltage; (E) CV
x 2 4
curves of the ACO electrode in 0.1 M PBS (pH 7.2) at different scan rates; (F) CV curves of the ACO electrode exposed to different
glucose concentrations (0, 2, 4, 6, and 8 mM) in 0.1 M PBS (pH 7.2). ACO: Annealed Cu-Oxide; CV: cyclic voltammetry; LSV: linear
sweep voltammograms; PBS: phosphate buffer solution.
Supplementary Figure 2 shows the results of similar tests of the ACO
voltages [Figure 4E and F].
electrode in Ringer’s Solution containing 0.1 mol/L NaCl and SBF solution containing 0.1 mol/L NaCl,
and both sets of results confirmed that the as-prepared ACO electrode exhibited great glucose-sensing
responses in these buffer solutions. These results indicate that the ACO electrode exhibited a certain
electrocatalytic efficiency in the glucose oxidation process, while the Ga-LM electrodes exhibited almost
zero activity in the same process.
Normally, the applied potential strongly influences the amperometric response of an electrochemical
sensing system to glucose. Figure 5A illustrates the amperometric response of the proposed system to 1 mM
glucose in 0.5 M Na SO at various applied potentials. The current response increased as the applied
4
2
potential was increased from 0 to -0.5 V. Nevertheless, to achieve high selectivity and avoid electrochemical
corrosion of the LM at higher potentials, -0.4 V was selected as the ideal detection potential for further
amperometric measurements. A chronoamperometry test was performed to evaluate the effective linear
range and sensitivity of the ACO electrode, wherein different glucose concentrations were added to 50 mL
of 0.5 M Na SO at intervals of 25 s under an applied potential of -0.4 V. The amperometric response results
2
4
are presented in Figure 5B. Upon glucose addition, the current increased gradually, indicating that the ACO
electrode exhibited effective electrocatalytic ability for glucose oxidation. Moreover, a linear relationship
was observed between the current response and added glucose concentration across various concentration
ranges. The corresponding linear regression equations are as follows [Figure 5C]:
I (μA) = -21.77 C (mM) - 22.21 (1 μM - 100 μM) R = 0.87 (1)
2
2
I (μA) = -2.42 C (mM) - 23.72 (100 μM - 1.6 mM) R = 0.98 (2)
I (μA) = -1.07 C (mM) - 25.85 (1.6 mM - 10 mM) R = 0.99 (3)
2