
Page 73 - Read Online
P. 73
Luo et al. Soft Sci 2024;4:7 https://dx.doi.org/10.20517/ss.2023.40 Page 5 of 12
Figure 1. Schematic illustration of ACO electrode synthesis. ACO: Annealed Cu-Oxide; ITO: indium tin oxide.
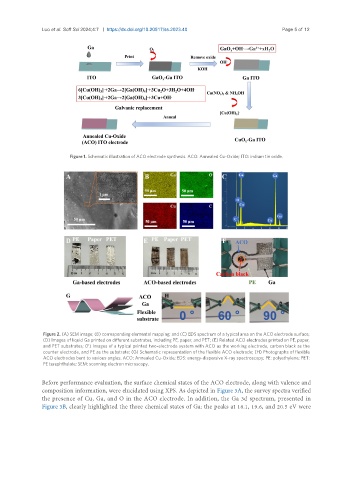
Figure 2. (A) SEM image; (B) corresponding elemental mapping; and (C) EDS spectrum of a typical area on the ACO electrode surface;
(D) Images of liquid Ga printed on different substrates, including PE, paper, and PET; (E) Related ACO electrodes printed on PE, paper,
and PET substrates; (F) Images of a typical printed two-electrode system with ACO as the working electrode, carbon black as the
counter electrode, and PE as the substrate; (G) Schematic representation of the flexible ACO electrode; (H) Photographs of flexible
ACO electrodes bent to various angles. ACO: Annealed Cu-Oxide; EDS: energy-dispersive X-ray spectroscopy; PE: polyethylene; PET:
PE terephthalate; SEM: scanning electron microscopy.
Before performance evaluation, the surface chemical states of the ACO electrode, along with valence and
composition information, were elucidated using XPS. As depicted in Figure 3A, the survey spectra verified
the presence of Cu, Ga, and O in the ACO electrode. In addition, the Ga 3d spectrum, presented in
Figure 3B, clearly highlighted the three chemical states of Ga: the peaks at 18.1, 19.6, and 20.5 eV were