
Page 74 - Read Online
P. 74
Page 6 of 12 Luo et al. Soft Sci 2024;4:7 https://dx.doi.org/10.20517/ss.2023.40
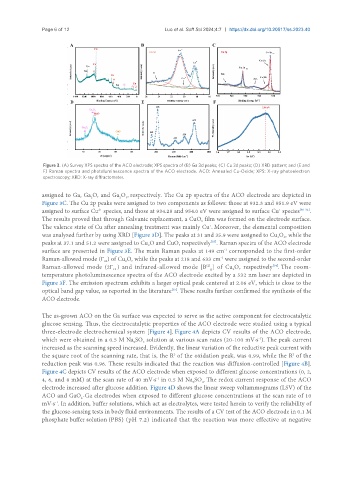
Figure 3. (A) Survey XPS spectra of the ACO electrode; XPS spectra of (B) Ga 3d peaks; (C) Cu 3d peaks; (D) XRD pattern; and (E and
F) Raman spectra and photoluminescence spectra of the ACO electrode. ACO: Annealed Cu-Oxide; XPS: X-ray photoelectron
spectroscopy; XRD: X-ray diffractometer.
assigned to Ga, Ga O, and Ga O , respectively. The Cu 2p spectra of the ACO electrode are depicted in
2
3
2
Figure 3C. The Cu 2p peaks were assigned to two components as follows: those at 932.3 and 951.9 eV were
2+
+
assigned to surface Cu species, and those at 934.28 and 954.0 eV were assigned to surface Cu species [30-32] .
The results proved that through Galvanic replacement, a CuO film was formed on the electrode surface.
x
The valence state of Cu after annealing treatment was mainly Cu . Moreover, the elemental composition
+
was analyzed further by using XRD [Figure 3D]. The peaks at 31 and 35.9 were assigned to Cu O , while the
3
4
peaks at 37.1 and 51.2 were assigned to Cu O and CuO, respectively . Raman spectra of the ACO electrode
[33]
2
-1
surface are presented in Figure 3E. The main Raman peaks at 149 cm corresponded to the first-order
Raman-allowed mode (Γ ) of Cu O, while the peaks at 218 and 633 cm were assigned to the second-order
-1
2
25
(2)
[34]
Raman-allowed mode (2Γ ) and infrared-allowed mode [B ] of Cu O, respectively . The room-
g
12-
2
temperature photoluminescence spectra of the ACO electrode excited by a 532 nm laser are depicted in
Figure 3F. The emission spectrum exhibits a larger optical peak centered at 2.06 eV, which is close to the
[35]
optical band gap value, as reported in the literature . These results further confirmed the synthesis of the
ACO electrode.
The as-grown ACO on the Ga surface was expected to serve as the active component for electrocatalytic
glucose sensing. Thus, the electrocatalytic properties of the ACO electrode were studied using a typical
three-electrode electrochemical system [Figure 4]. Figure 4A depicts CV results of the ACO electrode,
which were obtained in a 0.5 M Na SO solution at various scan rates (20-100 mV·s ). The peak current
-1
2
4
increased as the scanning speed increased. Evidently, the linear variation of the reductive peak current with
2
the square root of the scanning rate, that is, the R of the oxidation peak, was 0.99, while the R of the
2
reduction peak was 0.96. These results indicated that the reaction was diffusion-controlled [Figure 4B].
Figure 4C depicts CV results of the ACO electrode when exposed to different glucose concentrations (0, 2,
4, 6, and 8 mM) at the scan rate of 40 mV·s in 0.5 M Na SO . The redox current response of the ACO
-1
4
2
electrode increased after glucose addition. Figure 4D shows the linear sweep voltammograms (LSV) of the
ACO and GaO -Ga electrodes when exposed to different glucose concentrations at the scan rate of 10
x
mV·s . In addition, buffer solutions, which act as electrolytes, were tested herein to verify the reliability of
-1
the glucose-sensing tests in body fluid environments. The results of a CV test of the ACO electrode in 0.1 M
phosphate buffer solution (PBS) (pH 7.2) indicated that the reaction was more effective at negative