
Page 59 - Read Online
P. 59
Yue et al. Soft Sci 2023;3:13 https://dx.doi.org/10.20517/ss.2023.02 Page 7 of 11
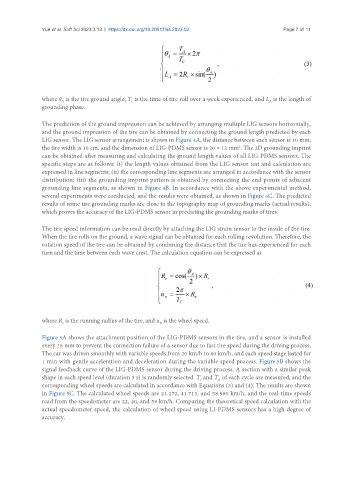
where θ is the tire ground angle, T is the time of tire roll over a week experienced, and L is the length of
c
A
A
grounding phase.
The prediction of the ground impression can be achieved by arranging multiple LIG sensors horizontally,
and the ground impression of the tire can be obtained by connecting the ground length predicted by each
LIG sensor. The LIG sensor arrangement is shown in Figure 4A, the distance between each sensor is 10 mm,
the tire width is 10 cm, and the dimension of LIG-PDMS sensor is 20 × 12 mm . The 2D grounding imprint
2
can be obtained after measuring and calculating the ground length values of all LIG-PDMS sensors. The
specific steps are as follows: (i) the length values obtained from the LIG sensor test and calculation are
expressed in line segments; (ii) the corresponding line segments are arranged in accordance with the sensor
distribution; (iii) the grounding imprint pattern is obtained by connecting the end points of adjacent
grounding line segments, as shown in Figure 4B. In accordance with the above experimental method,
several experiments were conducted, and the results were obtained, as shown in Figure 4C. The predicted
results of some tire grounding marks are close to the topography map of grounding marks (actual results),
which proves the accuracy of the LIG-PDMS sensor in predicting the grounding marks of tires.
The tire speed information can be read directly by attaching the LIG strain sensor to the inside of the tire.
When the tire rolls on the ground, a wave signal can be obtained for each rolling revolution. Therefore, the
rotation speed of the tire can be obtained by combining the distance that the tire has experienced for each
turn and the time between each wave crest. The calculation equation can be expressed as
where R is the running radius of the tire, and u is the wheel speed.
e
w
Figure 5A shows the attachment position of the LIG-PDMS sensors in the tire, and a sensor is installed
every 25 mm to prevent the connection failure of a sensor due to fast tire speed during the driving process.
The car was driven smoothly with variable speeds from 20 km/h to 60 km/h, and each speed stage lasted for
1 min with gentle acceleration and deceleration during the variable speed process. Figure 5B shows the
signal feedback curve of the LIG-PDMS sensor during the driving process. A section with a similar peak
shape in each speed level (duration 3 s) is randomly selected. T and T of each cycle are measured, and the
c
A
corresponding wheel speeds are calculated in accordance with Equations (3) and (4). The results are shown
in Figure 5C. The calculated wheel speeds are 21.272, 41.713, and 58.980 km/h, and the real-time speeds
read from the speedometer are 22, 40, and 59 km/h. Comparing the theoretical speed calculation with the
actual speedometer speed, the calculation of wheel speed using LI-PDMS sensors has a high degree of
accuracy.