
Page 148 - Read Online
P. 148
Li et al. Soft Sci 2023;3:22 https://dx.doi.org/10.20517/ss.2023.11 Page 11 of 15
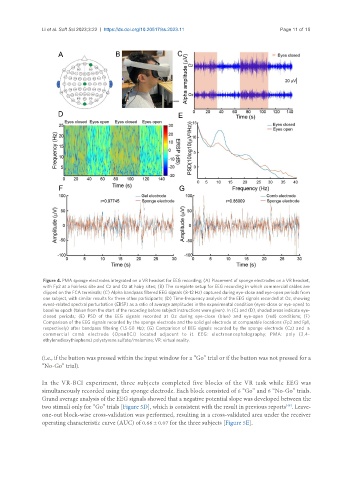
Figure 4. PMA sponge electrodes integrated on a VR headset for EEG recording; (A) Placement of sponge electrodes on a VR headset,
with Fp2 at a hairless site and Cz and Oz at hairy sites; (B) The complete setup for EEG recording in which commercial cables are
clipped on the FCA terminals; (C) Alpha bandpass filtered EEG signals (8-12 Hz) captured during eye-close and eye-open periods from
one subject, with similar results for three other participants; (D) Time-frequency analysis of the EEG signals recorded at Oz, showing
event-related spectral perturbation (ERSP) as a ratio of average amplitudes in the experimental condition (eyes-close or eye-open) to
baseline epoch (taken from the start of the recording before subject instructions were given). In (C) and (D), shaded areas indicate eye-
closed periods; (E) PSD of the EEG signals recorded at Oz during eye-close (blue) and eye-open (red) conditions; (F)
Comparison of the EEG signals recorded by the sponge electrode and the solid gel electrode at comparable locations (Fp2 and Fp1,
respectively) after bandpass filtering (1.5-50 Hz); (G) Comparison of EEG signals recorded by the sponge electrode (Cz) and a
commercial comb electrode (OpenBCI) located adjacent to it. EEG: electroencephalography; PMA: poly (3,4-
ethylenedioxythiophene) polystyrene sulfate/melamine; VR: virtual reality.
(i.e., if the button was pressed within the input window for a “Go” trial or if the button was not pressed for a
“No-Go” trial).
In the VR-BCI experiment, three subjects completed five blocks of the VR task while EEG was
simultaneously recorded using the sponge electrode. Each block consisted of 6 “Go” and 6 “No-Go” trials.
Grand average analysis of the EEG signals showed that a negative potential slope was developed between the
two stimuli only for “Go” trials [Figure 5D], which is consistent with the result in previous reports . Leave-
[46]
one-out block-wise cross-validation was performed, resulting in a cross-validated area under the receiver
operating characteristic curve (AUC) of 0.66 ± 0.07 for the three subjects [Figure 5E].