
Page 92 - Read Online
P. 92
Page 8 of 13 Yang et al. Plast Aesthet Res 2020;7:8 I http://dx.doi.org/10.20517/2347-9264.2019.63
A B C D
E F G H
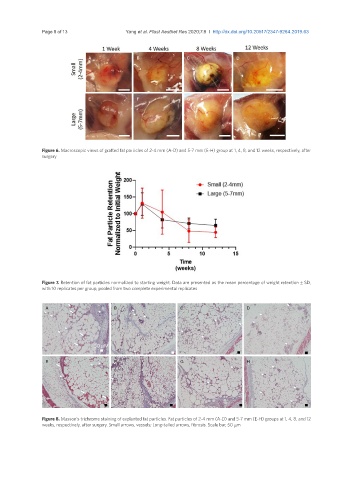
Figure 6. Macroscopic views of grafted fat particles of 2-4 mm (A-D) and 5-7 mm (E-H) group at 1, 4, 8, and 12 weeks, respectively, after
surgery
Figure 7. Retention of fat particles normalized to starting weight. Data are presented as the mean percentage of weight retention ± SD,
with 10 replicates per group, pooled from two complete experimental replicates
A B C D
E F G H
Figure 8. Masson’s trichrome staining of explanted fat particles. Fat particles of 2-4 mm (A-D) and 5-7 mm (E-H) groups at 1, 4, 8, and 12
weeks, respectively, after surgery. Small arrows, vessels; Long-tailed arrows, fibrosis. Scale bar, 50 μm