
Page 93 - Read Online
P. 93
Yang et al. Plast Aesthet Res 2020;7:8 I http://dx.doi.org/10.20517/2347-9264.2019.63 Page 9 of 13
*P < 0.05
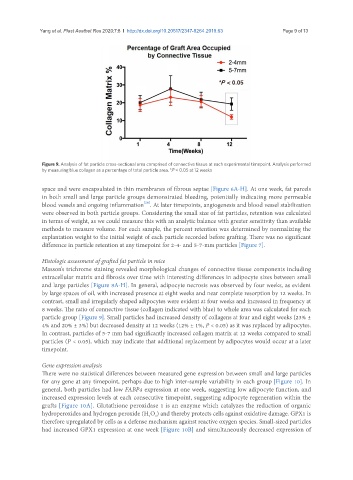
Figure 9. Analysis of fat particle cross-sectional area comprised of connective tissue at each experimental timepoint. Analysis performed
by measuring blue collagen as a percentage of total particle area. *P < 0.05 at 12 weeks
space and were encapsulated in thin membranes of fibrous septae [Figure 6A-H]. At one week, fat parcels
in both small and large particle groups demonstrated bleeding, potentially indicating more permeable
[26]
blood vessels and ongoing inflammation . At later timepoints, angiogenesis and blood vessel stabilization
were observed in both particle groups. Considering the small size of fat particles, retention was calculated
in terms of weight, as we could measure this with an analytic balance with greater sensitivity than available
methods to measure volume. For each sample, the percent retention was determined by normalizing the
explantation weight to the initial weight of each particle recorded before grafting. There was no significant
difference in particle retention at any timepoint for 2-4- and 5-7-mm particles [Figure 7].
Histologic assessment of grafted fat particle in mice
Masson’s trichrome staining revealed morphological changes of connective tissue components including
extracellular matrix and fibrosis over time with interesting differences in adipocyte sizes between small
and large particles [Figure 8A-H]. In general, adipocyte necrosis was observed by four weeks, as evident
by large spaces of oil, with increased presence at eight weeks and near complete resorption by 12 weeks. In
contrast, small and irregularly shaped adipocytes were evident at four weeks and increased in frequency at
8 weeks. The ratio of connective tissue (collagen indicated with blue) to whole area was calculated for each
particle group [Figure 9]. Small particles had increased density of collagens at four and eight weeks (23% ±
4% and 20% ± 3%) but decreased density at 12 weeks (12% ± 1%, P < 0.05) as it was replaced by adipocytes.
In contrast, particles of 5-7 mm had significantly increased collagen matrix at 12 weeks compared to small
particles (P < 0.05), which may indicate that additional replacement by adipocytes would occur at a later
timepoint.
Gene expression analysis
There were no statistical differences between measured gene expression between small and large particles
for any gene at any timepoint, perhaps due to high inter-sample variability in each group [Figure 10]. In
general, both particles had low FABP4 expression at one week, suggesting low adipocyte function, and
increased expression levels at each consecutive timepoint, suggesting adipocyte regeneration within the
grafts [Figure 10A]. Glutathione peroxidase 1 is an enzyme which catalyzes the reduction of organic
hydroperoxides and hydrogen peroxide (H O ) and thereby protects cells against oxidative damage. GPX1 is
2
2
therefore upregulated by cells as a defense mechanism against reactive oxygen species. Small-sized particles
had increased GPX1 expression at one week [Figure 10B] and simultaneously decreased expression of