
Page 90 - Read Online
P. 90
Page 6 of 13 Yang et al. Plast Aesthet Res 2020;7:8 I http://dx.doi.org/10.20517/2347-9264.2019.63
A
B
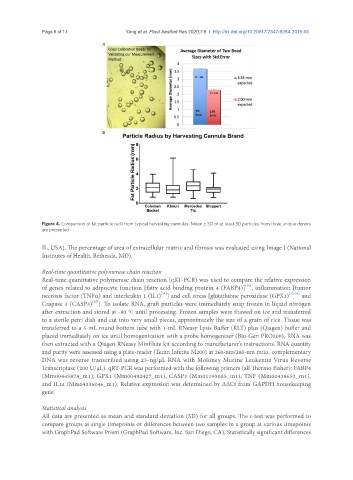
Figure 4. Comparison of fat particle radii from typical harvesting cannulas. Mean ± SD of at least 50 particles from three unique donors
are presented
IL, USA). The percentage of area of extracellular matrix and fibrosis was evaluated using Image J (National
Institutes of Health, Bethesda, MD).
Real-time quantitative polymerase chain reaction
Real-time quantitative polymerase chain reaction (qRT-PCR) was used to compare the relative expression
[20]
of genes related to adipocyte function [fatty acid binding protein 4 (FABP4)] , inflammation [tumor
[21]
necrosis factor (TNFα) and interleukin 1 (IL1) ] and cell stress [glutathione peroxidase (GPX1) [22-24] and
[25]
Caspase 3 (CASP3) ]. To isolate RNA, graft particles were immediately snap frozen in liquid nitrogen
after extraction and stored at -80 °C until processing. Frozen samples were thawed on ice and transferred
to a sterile petri dish and cut into very small pieces, approximately the size of a grain of rice. Tissue was
transferred to a 5-mL round bottom tube with 1-mL RNeasy Lysis Buffer (RLT) plus (Qiagen) buffer and
placed immediately on ice until homogenization with a probe homogenizer (Bio-Gen PRO200). RNA was
then extracted with a Qiagen RNeasy MinElute kit according to manufacturer’s instructions. RNA quantity
and purity were assessed using a plate-reader (Tecan Infinite M200) at 260-nm/280-nm ratio. complementary
DNA was reverse transcribed using 25-ng/µL RNA with Moloney Murine Leukemia Virus Reverse
Transcriptase (200 U/µL). qRT-PCR was performed with the following primers (all Thermo Fisher): FABP4
(Mm00445878_m1); GPX1 (Mm00492427_m1), CASP3 (Mm01195085_m1), TNF (Mm00438653_m1),
and IL1a (Mm04336046_m1). Relative expression was determined by ΔΔCt from GAPDH housekeeping
gene.
Statistical analysis
All data are presented as mean and standard deviation (SD) for all groups. The t-test was performed to
compare groups at single timepoints or differences between two samples in a group at various timepoints
with GraphPad Software Prism (GraphPad Software, Inc. San Diego, CA). Statistically significant differences