
Page 107 - Read Online
P. 107
Keren et al. NMR for human fat graft assessment
fat mass. The advantage of the NMR analyzer is in NMR analysis. Most mice demonstrated a consistent
its ability to characterize the water content, lean body decrease in fat graft weight (34 ± 7%) with only 1
mass, and fat mass into separate measurements. mouse demonstrating an 80% decrease in fat weight
7 weeks following transplantation.
The distribution of the human fat within the tested
mice is demonstrated in Figure 4. Although prior to DISCUSSION
transplantation all mice demonstrated variable fat
content with the most lean mouse having 2.2 gr of Autologous fat transplantation was first described
fat and the most obese mouse having 4.6 gr of fat a century ago, but only in the past decade has it
content (average of 3.7 gr with standard deviation of gained attention as an ideal filler for soft tissue
0.8), 1 day following fat transplantation the average reconstruction. [21] Because of the unpredictable
transplanted fat content (calculated as fat content outcomes associated with autologous fat
1 day post transplantation minus fat content 1 day transplantation, clinical scientists and physicians
before transplantation) was much less variable (2.2 gr have experimented with various methods to find
with standard deviation of 0.2). ways to increase the viability of injected fat while
reducing its rate of reabsorption. [22] Researchers
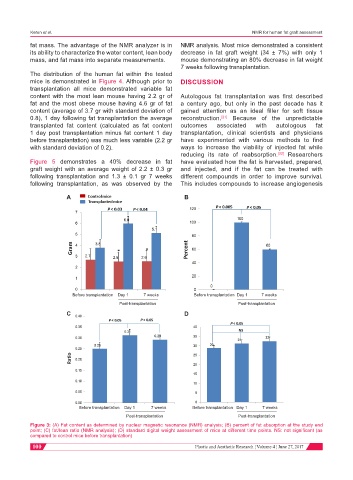
Figure 5 demonstrates a 40% decrease in fat have evaluated how the fat is harvested, prepared,
graft weight with an average weight of 2.2 ± 0.3 gr and injected, and if the fat can be treated with
following transplantation and 1.3 ± 0.1 gr 7 weeks different compounds in order to improve survival.
following transplantation, as was observed by the This includes compounds to increase angiogenesis
A B
Before transplantation Day 1 7 weeks Before transplantation Day 1 7 weeks
Post-transplantation Post-transplantation
C D
Before transplantation Day 1 7 weeks Before transplantation Day 1 7 weeks
Post-transplantation Post-transplantation
Figure 3: (A) Fat content as determined by nuclear magnetic resonance (NMR) analysis; (B) percent of fat absorption at the study end
point; (C) fat/lean ratio (NMR analysis); (D) standard digital weight assessment of mice at different time points. NS: not significant (as
compared to control mice before transplantation)
100 Plastic and Aesthetic Research ¦ Volume 4 ¦ June 27, 2017