
Page 106 - Read Online
P. 106
Keren et al. NMR for human fat graft assessment
were acclimatized for 5 days prior to the study, and fed Statistical analysis
standard chow and water ad libitum. Means and standard deviation were calculated.
Differences between means were analyzed for
The recipient area of the mouse was disinfected with statistical significance using one-way analysis of
70% ethanol. Fat was subsequently slowly injected as variance with the Tukey-Kramer multiple comparisons
small droplets into multiple tunnels in the two lateral post test (SPSS version 17.0). P values ≤ 0.05 were
sides of 7 nude mice at 1 mL volume per side (for a considered significant.
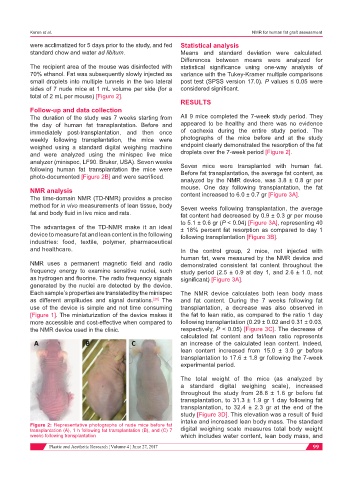
total of 2 mL per mouse) [Figure 2].
RESULTS
Follow-up and data collection
The duration of the study was 7 weeks starting from All 9 mice completed the 7-week study period. They
the day of human fat transplantation. Before and appeared to be healthy and there was no evidence
immediately post-transplantation, and then once of cachexia during the entire study period. The
weekly following transplantation, the mice were photographs of the mice before and at the study
weighed using a standard digital weighing machine endpoint clearly demonstrated the resorption of the fat
and were analyzed using the minispec live mice droplets over the 7-week period [Figure 2].
analyzer (minispec, LF90. Bruker, USA). Seven weeks
following human fat transplantation the mice were Seven mice were transplanted with human fat.
photo-documented [Figure 2B] and were sacrificed. Before fat transplantation, the average fat content, as
analyzed by the NMR device, was 3.8 ± 0.8 gr per
NMR analysis mouse. One day following transplantation, the fat
The time-domain NMR (TD-NMR) provides a precise content increased to 6.0 ± 0.7 gr [Figure 3A].
method for in vivo measurements of lean tissue, body Seven weeks following transplantation, the average
fat and body fluid in live mice and rats. fat content had decreased by 0.9 ± 0.3 gr per mouse
to 5.1 ± 0.6 gr (P < 0.04) [Figure 3A], representing 40
The advantages of the TD-NMR make it an ideal ± 18% percent fat resorption as compared to day 1
device to measure fat and lean content in the following following transplantation [Figure 3B].
industries: food, textile, polymer, pharmaceutical
and healthcare. In the control group, 2 mice, not injected with
human fat, were measured by the NMR device and
NMR uses a permanent magnetic field and radio demonstrated consistent fat content throughout the
frequency energy to examine sensitive nuclei, such study period (2.5 ± 0.9 at day 1, and 2.6 ± 1.0, not
as hydrogen and fluorine. The radio frequency signals significant) [Figure 3A].
generated by the nuclei are detected by the device.
Each sample’s properties are translated by the minispec The NMR device calculates both lean body mass
as different amplitudes and signal durations. The and fat content. During the 7 weeks following fat
[20]
use of the device is simple and not time consuming transplantation, a decrease was also observed in
[Figure 1]. The miniaturization of the device makes it the fat to lean ratio, as compared to the ratio 1 day
more accessible and cost-effective when compared to following transplantation (0.29 ± 0.02 and 0.31 ± 0.03,
the NMR device used in the clinic. respectively, P < 0.05) [Figure 3C]. The decrease of
calculated fat content and fat/lean ratio represents
an increase of the calculated lean content. Indeed,
lean content increased from 15.0 ± 3.0 gr before
transplantation to 17.6 ± 1.8 gr following the 7-week
experimental period.
The total weight of the mice (as analyzed by
a standard digital weighing scale), increased
throughout the study from 28.8 ± 1.6 gr before fat
transplantation, to 31.3 ± 1.9 gr 1 day following fat
transplantation, to 32.4 ± 2.3 gr at the end of the
study [Figure 3D]. This elevation was a result of fluid
intake and increased lean body mass. The standard
Figure 2: Representative photographs of nude mice before fat
transplantation (A), 1 h following fat transplantation (B), and (C) 7 digital weighing scale measures total body weight
weeks following transplantation which includes water content, lean body mass, and
Plastic and Aesthetic Research ¦ Volume 4 ¦ June 27, 2017 99