
Page 68 - Read Online
P. 68
found in the upper outer quadrant of the thigh, as opposed segments 4 and 5 arising from the TBLCFA and in segment
[9]
to the study of Kim et al., which showed perforators 5 for perforators arising from the DBLCFA. Our study
primarily in the lower outer quadrant of the thigh. showed an overall kappa value of 1 (very good agreement)
for MDCTA in demonstrating the source of perforators,
Sensitivity, specificity, accuracy of Doppler similar to the study by Garvey et al., The Doppler was
[13]
versus MDCTA in localization unable to provide any information regarding source
[2]
Yu et al., in 2006, evaluated the accuracy of handheld vessel, course, and size of perforators.
Doppler and found it to be overly sensitive, poorly specific,
and inaccurate in locating perforators. The current study Surgeons’ stress levels
showed an overall sensitivity of 74% and specificity of This study attempted to objectively classify the stress level
80.86% for Doppler in the demonstration of the presence of a surgeon during flap harvest and perforator dissection.
of a perforator. Lin et al. conducted another study in Taylor et al. [3,14] used the retrograde VAS to assess the surgeons’
[12]
2011 in which MDCTA demonstrated a sensitivity of 74% stress levels during deep inferior epigastric artery perforator
and specificity of 90% in 16 patients. The current study (DIEP) dissection. This was subjectable to recall bias and
showed a sensitivity and specificity for MDCTA of 85.71% hence unreliable. In our study, the surgeon’s operative stress
and 97.22% in demonstrating the presence of a perforator score was analyzed prospectively. The difference in mean
[Table 3], while that for Doppler alone was 80% and 87.91%, scores of the surgeon’s stress level during flap harvest was not
respectively in Group 1 [Table 4]. MDCTA was superior statistically significant, likely secondary to the small number
to Doppler in accurate localization of the perforators in of cases. However, the mean flap harvest time for Surgeon
segments 3, 4, and 6. However, no difference was seen A was significantly less in Group 1 (P = 0.046). No similar
in segment 5. Doppler showed less accuracy in localizing studies have been reported in literature.
perforators when the BMI increased.
Complications
Perforator source This study found no significant differences in flap
The sensitivity of MDCTA in the detection of the source of survival or donor site complications in patients who
the perforators decreased from proximal to distal while underwent MDCTA versus those who did not (P =
the specificity remained high in all segments, similar to 0.26). This is in contrast to other studies of the DIEP
a study by Garvey et al. Perforators appeared to be flap, where preoperative MDCTA significantly decreased
[13]
better visualized when surrounded by subcutaneous fat, the incidence of marginal necrosis and donor site
which decreases from proximal to distal in the thigh. morbidity. However, it would probably be incorrect to
[14]
MDCTA had 100% sensitivity, 91.66% specificity, and 100% extrapolate data obtained from an abdominal donor site
accuracy in demonstrating the source of perforators in and compare it to a thigh donor site. In the current study,
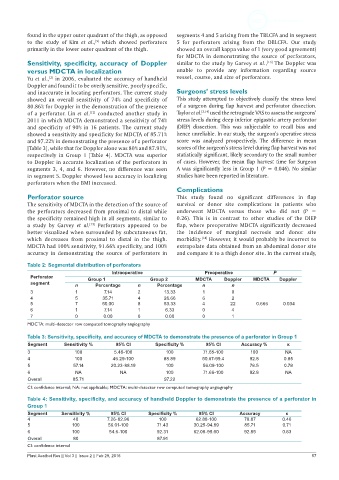
Table 2: Segmental distribution of perforators
Intraoperative Preoperative P
Perforator Group 1 Group 2 MDCTA Doppler MDCTA Doppler
segment n Percentage n Percentage n n
3 1 7.14 2 13.33 1 0
4 5 35.71 4 26.66 6 2
5 7 50.00 8 53.33 4 22 0.666 0.034
6 1 7.14 1 6.33 0 4
7 0 0.00 0 0.00 0 1
MDCTA: multi-detector row computed tomography angiography
Table 3: Sensitivity, specificity, and accuracy of MDCTA to demonstrate the presence of a perforator in Group 1
Segment Sensitivity % 95% CI Specificity % 95% CI Accuracy % κ
3 100 5.46-100 100 71.65-100 100 NA
4 100 46.29-100 88.89 50.67-99.4 92.8 0.85
5 57.14 20.23-88.19 100 56.09-100 78.5 0.78
6 NA NA 100 71.66-100 92.8 NA
Overall 85.71 97.22
CI: confidence interval; NA: not applicable; MDCTA: multi-detector row computed tomography angiography
Table 4: Sensitivity, specificity, and accuracy of handheld Doppler to demonstrate the presence of a perforator in
Group 1
Segment Sensitivity % 95% CI Specificity % 95% CI Accuracy κ
4 40 7.26-82.96 100 62.88-100 78.87 0.46
5 100 56.01-100 71.43 30.25-94.89 85.71 0.71
6 100 54.6-100 92.31 62.08-99.60 92.85 0.63
Overall 80 87.91
CI: confidence interval
Plast Aesthet Res || Vol 3 || Issue 2 || Feb 29, 2016 57