
Page 355 - Read Online
P. 355
Kanevsky et al. Stretch device for scar therapy
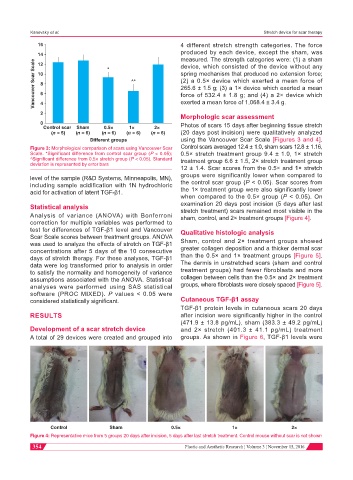
16 4 different stretch strength categories. The force
produced by each device, except the sham, was
14 * measured. The strength categories were: (1) a sham
Vancouver Scar Scale 10 ^* spring mechanism that produced no extension force;
12
device, which consisted of the device without any
(2) a 0.5× device which exerted a mean force of
8
265.6 ± 1.5 g; (3) a 1× device which exerted a mean
6
force of 532.4 ± 1.8 g; and (4) a 2× device which
4
2 exerted a mean force of 1,068.4 ± 3.4 g.
Morphologic scar assessment
0 Photos of scars 15 days after beginning tissue stretch
Control scar Sham 0.5× 1× 2×
(n = 5) (n = 6) (n = 6) (n = 6) (n = 6) (20 days post incision) were qualitatively analyzed
Different groups using the Vancouver Scar Scale [Figures 3 and 4].
Figure 3: Morphological comparison of scars using Vancouver Scar Control scars averaged 12.4 ± 1.0, sham scars 12.8 ± 1.16,
Scale. *Significant difference from control scar group (P < 0.05); 0.5× stretch treatment group 9.4 ± 1.0, 1× stretch
^Significant difference from 0.5× stretch group (P < 0.05). Standard treatment group 6.6 ± 1.5, 2× stretch treatment group
deviation is represented by error bars
12 ± 1.4. Scar scores from the 0.5× and 1× stretch
level of the sample (R&D Systems, Minneapolis, MN), groups were significantly lower when compared to
including sample acidification with 1N hydrochloric the control scar group (P < 0.05). Scar scores from
acid for activation of latent TGF-β1. the 1× treatment group were also significantly lower
when compared to the 0.5× group (P < 0.05). On
Statistical analysis examination 20 days post incision (5 days after last
stretch treatment) scars remained most visible in the
Analysis of variance (ANOVA) with Bonferroni sham, control, and 2× treatment groups [Figure 4].
correction for multiple variables was performed to
test for differences of TGF-β1 level and Vancouver Qualitative histologic analysis
Scar Scale scores between treatment groups. ANOVA
was used to analyze the effects of stretch on TGF-β1 Sham, control and 2× treatment groups showed
concentrations after 5 days of the 10 consecutive greater collagen deposition and a thicker dermal scar
days of stretch therapy. For these analyses, TGF-β1 than the 0.5× and 1× treatment groups [Figure 5].
data were log transformed prior to analysis in order The dermis in unstretched scars (sham and control
to satisfy the normality and homogeneity of variance treatment groups) had fewer fibroblasts and more
assumptions associated with the ANOVA. Statistical collagen between cells than the 0.5× and 2× treatment
analyses were performed using SAS statistical groups, where fibroblasts were closely spaced [Figure 5].
software (PROC MIXED). P values < 0.05 were
considered statistically significant. Cutaneous TGF-β1 assay
TGF-β1 protein levels in cutaneous scars 20 days
RESULTS after incision were significantly higher in the control
(471.9 ± 13.8 pg/mL), sham (383.3 ± 49.2 pg/mL)
Development of a scar stretch device and 2× stretch (401.3 ± 41.1 pg/mL) treatment
A total of 29 devices were created and grouped into groups. As shown in Figure 6, TGF-β1 levels were
Control Sham 0.5× 1× 2×
Figure 4: Representative mice from 5 groups 20 days after incision, 5 days after last stretch treatment. Control mouse without scar is not shown
354 Plastic and Aesthetic Research ¦ Volume 3 ¦ November 15, 2016