
Page 31 - Read Online
P. 31
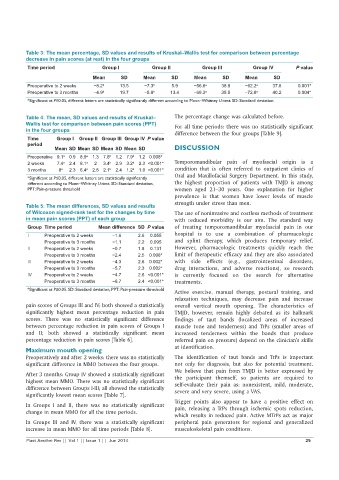
Table 3: The mean percentage, SD values and results of Kruskal–Wallis test for comparison between percentage
          decrease in pain scores (at rest) in the four groups
           Time period               Group I          Group II          Group III         Group IV       P value
                                  Mean     SD      Mean      SD      Mean      SD      Mean      SD
           Preoperative to 2 weeks  −8.2 b  13.5    −7.3 b   5.9     −56.6 a   38.8    −62.2 a   37.8     0.001*
           Preoperative to 3 months  −4.9 b  19.7   −5.8 b   13.4    −69.3 a   35.5    −72.8 a   40.2     0.004*
           *Significant at P≤0.05, different letters are statistically significantly different according to Mann–Whitney U‑test. SD: Standard deviation

          Table 4: The mean, SD values and results of Kruskal–  The percentage change was calculated before.
          Wallis test for comparison between pain scores (PPT)   For all time periods: there was no statistically significant
          in the four groups
                                                              difference between the four groups [Table 9].
           Time      Group I  Group II Group III Group IV P value
           period
                    Mean SD Mean SD Mean SD Mean SD           DISCUSSION
           Preoperative 9.1 a  0.9 8.9 a  1.3 7.8 b  1.2 7.9 b  1.2 0.008*
           2 weeks   7.4 a  2.4 8.1 a  2  3.4 b  2.9 3.2 b  2.3 <0.001*  Temporomandibular pain of myofascial origin  is  a
           3 months   8 a  2.3 6.4 a  2.8 2.1 b  2.4 1.2 b  1.9 <0.001*  condition that is  often  referred to outpatient  clinics of
                                                              Oral  and Maxillofacial Surgery  Department.  In  this  study,
           *Significant at P≤0.05, different letters are statistically significantly
           different according to Mann–Whitney U‑test. SD: Standard deviation,   the highest proportion  of patients with TMJD is among
           PPT: Pain‑pressure threshold                       women  aged 21–30  years.  One explanation for higher
                                                              prevalence is that women have lower levels of muscle
                                                              strength under stress than men.
          Table 5: The mean differences, SD values and results
          of Wilcoxon signed-rank test for the changes by time   The use of noninvasive and costless methods of treatment
          in mean pain scores (PPT) of each group             with reduced morbidity is our aim. The standard way
           Group Time period        Mean difference SD P value  of treating temporomandibular myofascial pain in our
           I     Preoperative to 2 weeks  −1.6    2.6  0.055  hospital is to use a combination of pharmacologic
                 Preoperative to 3 months  −1.1   2.2  0.095  and splint therapy, which produces temporary relief.
           II    Preoperative to 2 weeks  −0.7    1.8  0.131  However, pharmacologic treatments quickly reach the
                 Preoperative to 3 months  −2.4   2.5  0.008*  limit of therapeutic efficacy and they are also associated
           III   Preoperative to 2 weeks  −4.3    2.6  0.002*  with  side  effects  (e.g.,  gastrointestinal  disorders,
                 Preoperative to 3 months  −5.7   2.3  0.002*  drug interactions, and adverse reactions), so research
           IV    Preoperative to 2 weeks  −4.7    2.6 <0.001*  is currently focused on the search for alternative
                 Preoperative to 3 months  −6.7   2.4 <0.001*  treatments.
           *Significant at P≤0.05. SD: Standard deviation, PPT: Pain‑pressure threshold
                                                              Active exercise, manual therapy, postural training, and
                                                              relaxation techniques, may decrease pain and increase
          pain scores of Groups III and IV; both showed a statistically   overall vertical mouth opening. The characteristics of
          significantly highest mean percentage reduction in pain   TMJD, however, remain highly debated as its hallmark
          scores.  There  was  no  statistically  significant  difference   findings of taut bands  (localized areas of increased
          between  percentage  reduction  in  pain  scores  of  Groups  I   muscle tone and tenderness) and TrPs  (smaller areas of
          and II; both showed a statistically significant mean   increased tenderness within the bands that produce
          percentage reduction in pain scores [Table 6].      referred pain on pressure) depend on the clinician’s skills
          Maximum mouth opening                               at identification.
          Preoperatively and after 2 weeks: there was no statistically   The identification of taut bands and TrPs is important
          significant difference in MMO between the four groups.  not only for diagnosis,  but also for potential treatment.
                                                              We believe  that pain from TMJD is better  expressed by
          After 3 months: Group IV showed a statistically significant   the  participant themself,  so patients  are  required to
          highest mean MMO. There was no statistically significant   self-evaluate their pain as: nonexistent,  mild, moderate,
          difference between Groups I-III; all showed the statistically   severe and very severe, using a VAS.
          significantly lowest mean scores [Table 7].
                                                              Trigger points also  appear  to have a positive effect on
          In  Groups  I  and II,  there  was  no  statistically  significant   pain, releasing  a TrPs  through ischemic  spots reduction,
          change in mean MMO for all the time periods.
                                                              which results in reduced pain. Active MTrPs act as major
          In Groups  III  and IV, there was a statistically significant   peripheral pain generators for regional and generalized
          increase in mean MMO for all time periods [Table 8].  musculoskeletal pain conditions.

          Plast Aesthet Res || Vol 1 || Issue 1 ||  Jun 2014                                                25